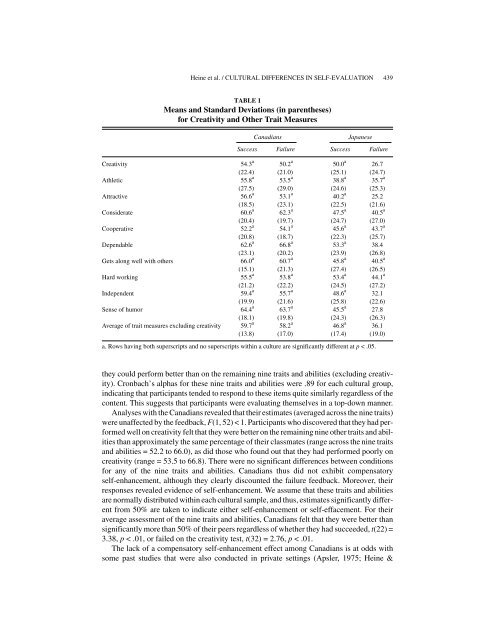
Heine et al. / <strong>CULTURAL</strong> <strong>DIFFERENCES</strong> <strong>IN</strong> <strong>SELF</strong>-<strong>EVALUATION</strong> 439TABLE 1Means and Standard Deviations (in parentheses)for Creativity and Other Trait MeasuresCanadians<strong>Japanese</strong>Success Failure Success FailureCreativity 54.3 a 50.2 a 50.0 a 26.7(22.4) (21.0) (25.1) (24.7)Athletic 55.8 a 53.5 a 38.8 a 35.7 a(27.5) (29.0) (24.6) (25.3)Attractive 56.6 a 53.1 a 40.2 a 25.2(18.5) (23.1) (22.5) (21.6)Considerate 60.6 a 62.3 a 47.5 a 40.5 a(20.4) (19.7) (24.7) (27.0)Cooperative 52.2 a 54.1 a 45.6 a 43.7 a(20.8) (18.7) (22.3) (25.7)Dependable 62.6 a 66.8 a 53.3 a 38.4(23.1) (20.2) (23.9) (26.8)Gets along well with others 66.0 a 60.7 a 45.8 a 40.5 a(15.1) (21.3) (27.4) (26.5)Hard working 55.5 a 53.8 a 53.4 a 44.1 a(21.2) (22.2) (24.5) (27.2)Independent 59.4 a 55.7 a 48.6 a 32.1(19.9) (21.6) (25.8) (22.6)Sense of humor 64.4 a 63.7 a 45.5 a 27.8(18.1) (19.8) (24.3) (26.3)Average of trait measures excluding creativity 59.7 a 58.2 a 46.8 a 36.1(13.8) (17.0) (17.4) (19.0)a. Rows having both superscripts and no superscripts within a culture are significantly different at p < .05.they could perform better than on the remaining nine traits and abilities (excluding creativity).Cronbach’s alphas for these nine traits and abilities were .89 for each cultural group,indicating that participants tended to respond to these items quite similarly regardless of thecontent. This suggests that participants were evaluating themselves in a top-down manner.Analyses with the Canadians revealed that their estimates (averaged across the nine traits)were unaffected by the feedback, F(1, 52) < 1. Participants who discovered that they had performedwell on creativity felt that they were better on the remaining nine other traits and abilitiesthan approximately the same percentage of their classmates (range across the nine traitsand abilities = 52.2 to 66.0), as did those who found out that they had performed poorly oncreativity (range = 53.5 to 66.8). There were no significant differences between conditionsfor any of the nine traits and abilities. Canadians thus did not exhibit compensatoryself-enhancement, although they clearly discounted the failure feedback. Moreover, theirresponses revealed evidence of self-enhancement. We assume that these traits and abilitiesare normally distributed within each cultural sample, and thus, estimates significantly differentfrom 50% are taken to indicate either self-enhancement or self-effacement. For theiraverage assessment of the nine traits and abilities, Canadians felt that they were better thansignificantly more than 50% of their peers regardless of whether they had succeeded, t(22) =3.38, p < .01, or failed on the creativity test, t(32) = 2.76, p < .01.The lack of a compensatory self-enhancement effect among Canadians is at odds withsome past studies that were also conducted in private settings (Apsler, 1975; Heine &
440 JOURNAL OF CROSS-<strong>CULTURAL</strong> PSYCHOLOGYLehman, 1997a; Steele et al., 1993). However, other researchers have noted that compensatoryself-enhancement with North Americans is only reliably found in public settings(Baumeister & Jones, 1978; Greenberg & Pyszczynski, 1985). Thus, we expect that if theCanadian participants had been presented with public feedback, they would have replicatedthe robust compensatory self-enhancement pattern.Analyses with <strong>Japanese</strong> revealed a different pattern. <strong>Japanese</strong> who had performed well onthe creativity task felt that they were better on the other nine traits and abilities than significantlymore of their classmates (M = 46.8, SD = 17.4; range across the nine traits and abilities= 38.8 to 53.4) than did those who had performed poorly (M = 36.1, SD = 19.0; range =25.2 to 44.1), F(1, 65) = 5.63, p < .03. Significant differences emerged across conditions forfour of the nine traits (attractive, dependable, independent, and sense of humor). That is,<strong>Japanese</strong> in the failure condition did not show evidence of trying to compensate for theirnewly discovered shortcoming in creativity by bolstering their other self-assessments, nordid they show the tendency observed with the Canadian sample to discount the failure feedbackthat they had received. Rather, our <strong>Japanese</strong> sample adopted a more critical view thatpermeated other aspects of their self-evaluations—a tendency that could be labeled“reverse compensatory self-enhancement.” These results corroborate the notion fromself-improvement theory (Heine et al., 1999; Heine et al., in press; Kitayama et al., 1997)that <strong>Japanese</strong> are highly sensitive to information indicating their weaknesses. This pattern ofreverse compensatory self-enhancement has never been observed in published studies ofNorth Americans.Analyses were conducted to see whether <strong>Japanese</strong> estimates departed significantly fromthe 50% benchmark. <strong>Japanese</strong> showed evidence of self-criticism after failure (their estimateswere significantly below 50%), t(32) = –3.75, p < .001, but not after success, t(35) =–1.13, ns.It is possible that creativity may hold different value within the two cultural groups, andthis might have affected the results. For example, many would suggest that Canadians valuecreativity more than <strong>Japanese</strong>. However, cross-cultural comparisons of values are notoriouslyunreliable as they are affected by both deprivation and reference-group effects (Peng,Nisbett, & Wong, 1997). In fact, as reported in Heine et al. (in press), cross-cultural comparisonsof how greatly creativity was viewed as important for success in the two samplesrevealed that <strong>Japanese</strong> viewed creativity to be significantly more important than Canadians.Moreover, <strong>Japanese</strong> viewed creativity as more important when they had failed, whereasCanadians showed a nonsignificant trend to view it as more important when they had succeeded.Different patterns of compensatory self-enhancement results may emerge if feedbackis given regarding domains that are of more or less importance to participants. Thatreverse compensatory self-enhancement has never before been observed among NorthAmericans, even though studies have manipulated domains of considerable importance toparticipants (e.g., Baumeister & Jones, 1978; Steele et al., 1993), suggests that the <strong>Japanese</strong>pattern of results cannot simply be explained away by the reported greater importance ofcreativity.DISCUSSIONIn contrast to North American tendencies to respond to negative self-relevant informationby discounting the feedback or by engaging in compensatory self-enhancement, the presentdata suggest that <strong>Japanese</strong> are especially sensitive and responsive to failure feedback. When