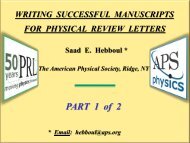
Dr. Hebboul's PRL Workshop Part 2 slides
Dr. Hebboul's PRL Workshop Part 2 slides
Dr. Hebboul's PRL Workshop Part 2 slides

You also want an ePaper? Increase the reach of your titles
YUMPU automatically turns print PDFs into web optimized ePapers that Google loves.
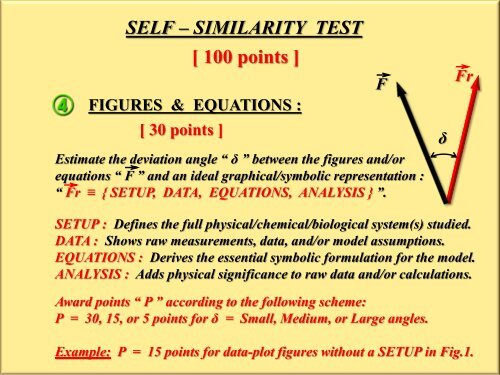
SELF – SIMILARITY TEST[ 100 points ]FIGURES & EQUATIONS :[ 30 points ]Estimate the deviation angle “ δ ” between the figures and/orequations “ F ” and an ideal graphical/symbolic representation :“ Fr ≡ { SETUP, DATA, EQUATIONS, ANALYSIS } ”.FδFrSETUP : Defines the full physical/chemical/biological system(s) studied.DATA : Shows raw measurements, data, and/or model assumptions.EQUATIONS : Derives the essential symbolic formulation for the model.ANALYSIS : Adds physical significance to raw data and/or calculations.Award points “ P ” according to the following scheme:P = 30, 15, or 5 points for δ = Small, Medium, or Large angles.Example: P = 15 points for data-plot figures without a SETUP in Fig.1.