Global Logistics Guide - Inbound Logistics
Global Logistics Guide - Inbound Logistics
Global Logistics Guide - Inbound Logistics

Create successful ePaper yourself
Turn your PDF publications into a flip-book with our unique Google optimized e-Paper software.
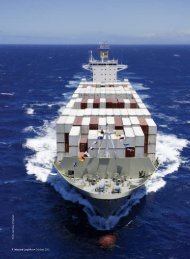
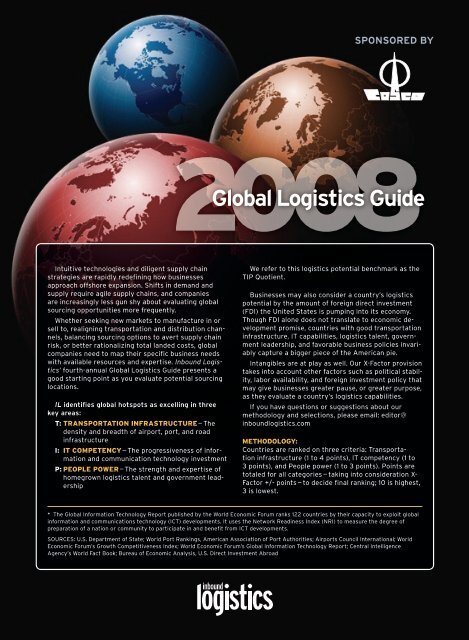
SPONSORED BY2008<strong>Global</strong> <strong>Logistics</strong> <strong>Guide</strong>Intuitive technologies and diligent supply chainstrategies are rapidly redefining how businessesapproach offshore expansion. Shifts in demand andsupply require agile supply chains, and companiesare increasingly less gun shy about evaluating globalsourcing opportunities more frequently.Whether seeking new markets to manufacture in orsell to, realigning transportation and distribution channels,balancing sourcing options to avert supply chainrisk, or better rationalizing total landed costs, globalcompanies need to map their specific business needswith available resources and expertise. <strong>Inbound</strong> <strong>Logistics</strong>’fourth-annual <strong>Global</strong> <strong>Logistics</strong> <strong>Guide</strong> presents agood starting point as you evaluate potential sourcinglocations.IL identifies global hotspots as excelling in threekey areas:T: Transportation Infrastructure — Thedensity and breadth of airport, port, and roadinfrastructureI: IT Competency — The progressiveness of informationand communication technology investmentP: People Power — The strength and expertise ofhomegrown logistics talent and government leadershipWe refer to this logistics potential benchmark as theTIP Quotient.Businesses may also consider a country’s logisticspotential by the amount of foreign direct investment(FDI) the United States is pumping into its economy.Though FDI alone does not translate to economic developmentpromise, countries with good transportationinfrastructure, IT capabilities, logistics talent, governmentleadership, and favorable business policies invariablycapture a bigger piece of the American pie.Intangibles are at play as well. Our X-Factor provisiontakes into account other factors such as political stability,labor availability, and foreign investment policy thatmay give businesses greater pause, or greater purpose,as they evaluate a country’s logistics capabilities.If you have questions or suggestions about ourmethodology and selections, please email: editor@inboundlogistics.comMETHODOLOGY:Countries are ranked on three criteria: Transportationinfrastructure (1 to 4 points), IT competency (1 to3 points), and People power (1 to 3 points). Points aretotaled for all categories — taking into consideration X-Factor +/- points — to decide final ranking; 10 is highest,3 is lowest.* The <strong>Global</strong> Information Technology Report published by the World Economic Forum ranks 122 countries by their capacity to exploit globalinformation and communications technology (ICT) developments. It uses the Network Readiness Index (NRI) to measure the degree ofpreparation of a nation or community to participate in and benefit from ICT developments.Sources: U.S. Department of State; World Port Rankings, American Association of Port Authorities; Airports Council International; WorldEconomic Forum’s Growth Competitiveness Index; World Economic Forum’s <strong>Global</strong> Information Technology Report; Central IntelligenceAgency’s World Fact Book; Bureau of Economic Analysis, U.S. Direct Investment Abroad
TheAmericasCanadaMexicoGDP: $1.4 trillion SCORE T 3GDP: $886 billion SCORE T 2EXPORTS: $268 billion6I 1IMPORTS: $279 billion P 2FDI (2006): $85 billion X 1FACTOR: Commitment to transportationinvestment and proximity to U.S. marketsMexico’s economic reckoning continues to growas U.S. companies face difficulties getting productto market through congested and capacity-con-strained chokepoints. President Felipe Calderonhas made fighting corruption and creating bureau-cratic transparency critical initiatives in bringingmore credibility to Mexico’s economic blueprint.The country’s coastal transport infrastructure,namely the ports of Manzanillo, Lazaro Cardenas,and Veracruz, are fast gaining recognition as majorcontainer conduits,but questions still remain aboutthe quality of roads beyond the developed northernregion. A five-year, $37-billion public-private fundingpackage, recently announced by Calderon, willhelp stimulate improvements across all modes.EXPORTS: $440 billion8I 3IMPORTS: $394 billion P 3FDI (2006): $246 billion X -1FACTOR: IT and skilled labor shortageThe United States’ largest trading partner and borderconfidant is among the foremost global economiesand is well prepared to capture more Asia-NorthAmerica trade, especially as U.S. West Coast containervolumes balloon. With $1.5 billion worth ofgoods crossing the U.S./Canada border daily, thetwo economies are inherently linked. The Port ofVancouver remains an important cargo port for bothCanada and the United States, and the emergingpromise of Prince Rupert, combined with an extensiveand underutilized railroad network, could be amajor boon for the country’s economic prospects.In 2006, U.S. companies contributed $246 billionin direct investment to Canada, up from $166 billionin 2002. Still, unbalanced economic growth (asa result of Western Canada’s Asian-fueled development),dependence on U.S. trade, increasingimmigration, and shortage of skilled labor are concernsthe government needs to address.ChileTIPGDP: $161 billion SCORE T 1EXPORTS: $66 billion4I 2IMPORTS: $42 billion P 1FDI (2006): $10 billion X 0Restrictive labor laws and high workforce turnoverhave created above-average unemploymentrates in recent years; resulting in an abundant, ifunstable, labor pool. Trade liberalization, includinga trade agreement with the United States in2004, has helped Chile attract foreign direct investment— ranking 28th globally and third in LatinAmerica to Mexico and Brazil. It is also well positionedin terms of IT infrastructure, ranking 31st inthe world and tops in Latin America, according to theWorld Economic Forum’s Network Readiness Index.But hurdles remain. Transportation is still largelyundeveloped and issues with intellectual propertytheft and counterfeiting have placed Chile on theU.S. Trade Representative’s Priority Watch List.Transportation InfrastructureInformation TechnologyPeople PowerBrazilGDP: $1.3 trillion SCORE T 2EXPORTS: $159 billion4I 1IMPORTS: $116 billion P 1FDI (2006): $33 billion X 0Brazil remains the heart of South American tradethanks in large part to a strong agricultural andexport-oriented economy. President Luiz InácioLula da Silva has been proactive in growing thecountry’s trade tentacles on the continent as wellas facilitating agreements with China, for example,and promoting public-private partnerships to stimulate much-needed funding for transportationinfrastructure investment. Some U.S. businessessee Brazil as another offshore manufacturing optionthat could someday rival the Asia Pacific. Abundantand cheap labor and proximity to U.S. markets weighin its favor. Manaus, a river port city and transportationhub in Northern Brazil, is attracting prominentmanufacturers such as Nokia, Samsung, Sony, andEssilor. Still, historically restrictive trade and laborlegislation and poor inland road infrastructure arehurdles to widespread sourcing activity.<strong>Inbound</strong> <strong>Logistics</strong> • March 2008
The NetherlandsEurope& RussiaT Transportation InfrastructureI Information TechnologyP People PowerFranceSPONSORED BYGDP: $2.5 trillion SCORE T 3EXPORTS: $559 billion7I 2IMPORTS: $601 billion P 2FDI (2006): $66 billion X 0As the sixth-largest economy in the world, Francetouts two ports (Le Havre and Marseilles) amongthe world’s top 50 in cargo tonnage and Paris DeGaulle airport ranks 11th in total air cargo tonnage.But France does not command the U.S. FDI clout thatSwitzerland, Belgium, the Netherlands, Germany,and Luxembourg do. While privatization has beenan ongoing goal for the country as it attempts totransition to a freer market-oriented economy, governmentcontrol over transportation and industrysectors still remains apparent. Despite ranking highin workforce productivity, widespread and well-publicizedopposition to labor reform is an obstacle thatPresident Nicolas Sarkozy’s government is workingto overcome.GDP: $755 billion SCORE T 4EXPORTS: $465 billion8I 3IMPORTS: $402 billion P 2FDI (2006): $216 billion X -1FACTOR: Labor shortage and capacity constraintsThe Port of Rotterdam’s unexpected double-digitspike in container volume in 2007 serves as anappropriate example of the Netherlands’ economicexpectations. Despite concerns over capacity limitationsand congestion at the ports in Rotterdam andAmsterdam, sound transportation infrastructure,a favorable regulatory and customs environment,competitive transport rates, well-developed intermodalcapabilities, and a skilled labor force makethe country a top logistics location. And U.S. companieshave taken notice. In 2006, the Netherlandscollected $216 billion in U.S. FDI, making it the thirdmost popular investment destination for U.S. capitalafter the United Kingdom and Canada. With Asiancontainer volumes surging, and an unemploymentrate among the lowest in Europe, labor availabilitycould become an obstacle to further economicgrowth.BelgiumGDP: $443 billion SCORE T 4EXPORTS: $328 billion7I 2IMPORTS: $321 billion P 2FDI (2006): $52 billion X -1FACTOR: Reliance on imports and regional tradeBelgium’s location in Central Europe, combined withbooming container trade between Europe and Asiaand the emerging manufacturing appeal of Centraland Eastern Europe (CEE) and Russia, are strongindications of the country’s economic developmentprospects. For a country the size of Maryland, itsmultimodal transportation resources are beyondcompare. The Port of Antwerp, which surpassedeight million TEUs in 2007 — a 16-percent increaseover 2006 — is complemented by the emerging presenceof Zeebrugge (two million TEUs, 24 percentincrease over 2006). Belgium’s Brussels and Liegeairports are among the world’s top 50 in cargo tonnageand a dense network of roads, railways, andcanals facilitate cargo transportation capabilitiesthrough the country. On the downside, Belgium’seconomy is heavily focused on regional trade. Withfew natural resources, it relies heavily on importingthese materials, then finishing them for export. Thecountry is looking to expand its global trade partnershipsto account for this shortcoming.<strong>Inbound</strong> <strong>Logistics</strong> • March 2008
RussiaGDP: $1.3 trillion SCORE T 1EXPORTS: $365 billion5I 1IMPORTS: $260 billion P 2FDI (2006): $10 billion X 1 EstoniaGDP: $21 billion SCORE T 1EXPORTS: $11 billion6I 3IMPORTS: $15 billion P 2FDI (2006): $22 million X 0Estonia’s free-market economy is fast turning headsand becoming the gem of Eastern Europe. Current2007 estimates peg GDP growth at 7.3 percent — wellabove the EU average of 2.9 percent. The government’ssound fiscal approach since its accession intothe EU in 2004, complemented by strong IT infrastructuredevelopment, an emerging electronicssector, pro-business investment policies, and energyinterdependence has created a foundation for stableeconomic growth. Positioned strategically betweenEurope and Russia, on the coastof the Baltic Sea,Estonia could become a central distribution pivotfor Asia-Europe trade.GermanyGDP: $414 billion SCORE T 2EXPORTS: $201 billionGDP: $3.3 trillion SCORE T7I 34IMPORTS: $190 billionEXPORTS: $1.4 trillion8IP 33 FDI (2006): $90 billion X -1IMPORTS: $1.1 trillion P 2FDI (2006): $99 billion X -1FACTOR: Zurich dropped out of the world’s top 50cargo airportsFACTOR: Ongoing efforts to integrate East andWest and rising social welfare costsSwitzerland ranks second in the World EconomicForum’s <strong>Global</strong> Competitiveness Index, largely due If businesses think integrating disparate businessto its strong and stable business environment,partners and supply chains is difficult, imagine thegeographic location, and diverse cultural makeup.challenges of trying to mesh two completely uniqueTransportation remains a top priority in the Alpineeconomies. Germany, now nearly two decadescountry and investments in infrastructure acrossremoved from reunification, is still tinkering withall modes will likely feature importantly as manufacturingand logistics activities in Eastern Europelabor policies and social welfare programs to rationalizegaps between East and West. Long a bastioncontinue to evolve. Centrally situated in Europe,of manufacturing productivity, increasing competitionfrom “cheaper” Eastern European neighbors is through Switzerland, and the country’s alreadyproduct moving north/south inevitably has to gosiphoning some industrial activity. But Germany isefficient surface-bound cargo capabilities will begeographically and tactically positioned to fill thataugmented when the 35-mile-long Gotthard Basevoid with further investments in logistics and distribution-relatedactivities. The Port of Hamburgto strong high-tech, pharmaceutical, and financialTunnel through the Alps is completed in 2015. Thanksrivals Rotterdam as Europe’s busiest containersectors, Switzerland is among the European leadersin U.S. FDI, accumulating more than $90 billionport and Frankfurt, Lufthansa’s hub, is Europe’stop cargo airport. in capital investments in 2006.SwitzerlandFACTOR: Sustained economic growth andimminent entry into the WTOEchoes of Russia’s former regimes continue to shadethe country’s economic identity. Transportationinfrastructure still remains nebulous at best andquestions about government leadership and graftare recurring. The country also lacks adequate ITresources, ranking 70th in the World Economic Forum’s Network Readiness Index. Despite theseconsiderable challenges, the maturation of theEastern European market will only augment oppor-tunities for Russia to get up to speed in terms ofinfrastructure and industrial development. Economicgrowth has been on an upward tick for nine straightyears and U.S. confidence in Russia as a commercialinterest is evolving — FDI has grown nearly tenfoldsince 2002 to $10 billion in 2006. The United States has also been influential in paving the way forRussia’s entrance into the World Trade Organization(WTO), although recent debate between EU countriesover economic and human rights concerns hasstymied progress.March 2008 • <strong>Inbound</strong> <strong>Logistics</strong>
ChinaGDP: $3.2 trillion SCORE T 3EXPORTS: $1.2 trillion7I 1IMPORTS: $917 billion P 2FDI (2006): $22 billion X 1FACTOR: Government leadershipChina remains a primary focus of U.S. offshore interestsand the government’s control over investing inand building transportation infrastructure is unrivalled.As its coastal manufacturing regions becomemore developed and relatively more expensive, businessesare looking farther inland and westward tomine even cheaper production capacity. This meansU.S. businesses have to hurdle the challenges oftransporting product from China’s less developedhinterland to its ports, which adds time and costto the supply chain. Concerns over product qualityand intellectual property theft are recurring, but willunlikely stem the flow of trade from China to theUnited States. The country’s growing middle classalso presents a ripe opportunity for businesses tobegin targeting China as a sell-to market.United Arab EmiratesGDP: $190 billion SCORE T 3EXPORTS: $152 billion6I 2IMPORTS: $95 billion P 2FDI (2006): $5 billion X -1FACTOR: Dependency on oil, the “war effect,” andhigh real estate costsAs elsewhere in the Middle East, privatization anddiversification have been primary drivers as theUnited Arab Emirates (UAE) looks toward transportationand logistics development to attract a betterbalance of industries. Dubai ranks 17th in the worldin air cargo tonnage and its port is ninth in containervolume. The planned development of Dubai <strong>Logistics</strong>City and a new cargo airport at Jebel Ali — which willbe larger than London’s Heathrow and Chicago’sO’Hare combined — are drawing interest from globalbusinesses seeking strategic distribution hubs. Muchof Dubai’s current growth, in terms of cargo volumeand infrastructure development, is largely a resultof the war in Iraq and ongoing construction activitiesin the country, which bears questioning whetherUAE’s fast-paced growth is sustainable.<strong>Inbound</strong> <strong>Logistics</strong> • March 2008IndiaThailandGDP: $226 billion SCORE T 2EXPORTS: $143 billion5I 2IMPORTS: $122 billion P 1FDI (2006): $8 billion X 0As a primarily export-oriented country, Thailand’sdiverse manufacturing sectors — specifically hightechconsumer products, furniture, canned food,toys, and jewelry — are driving the country’s economicengine. Its transportation infrastructure,which includes Bangkok Airport and the Port ofLaem Chabang, has grown to support these industries.While the government is looking to liberalizetrade policies to spur more foreign investment,political instability, as evidenced by a military coupin 2006, has investors wary. Continued expansionof transportation, utility, and communication networksto match export volumes will be criticalinitiatives as the government looks to solicit moreforeign interest.GDP: $1 trillion SCORE T 2EXPORTS: $141 billion6I 1IMPORTS: $224 billion P 3FDI (2006):$9 billion X 0As U.S. businesses mull sourcing and outsourcedmanufacturing options in Asia, India is a perennialtarget in large part due to its mature businessprocess outsourcing (BPO) sector, available and educatedlabor force, and English language proficiency.Foreign investment to date, however, has been stifledby poor inland infrastructure and prohibitiveregulatory bureaucracy. U.S. FDI was a relativelypaltry $9 billion in 2006 — merely double what U.S.businesses are investing in Trinidad and Tobago.Ongoing government reform has helped facilitateforeign investment in the country, but transportationissues are still problematic. For the short term,businesses will continue to leverage third-partyresources to make inroads into the Indian marketas infrastructure development chases demand.
South KoreaGDP: $982 billion SCORE T 3EXPORTS: $372 billion8I 3IMPORTS: $357 billion P 2FDI (2006): $22 billion X 0North Korea, once a liability, may soon prove tobe an economic stimulus for South Korea. If theCommunist regime recognizes the huge opportunitythat lies in following China’s example and opening upits borders to foreign business, and not just foreignorchestras, South Korea’s fortunes as a manufacturinghub may grow considerably beyond its currentcapacity. Already, its transportation capabilitiesrival that of regional trade peers, with four portsand one airport among the world’s top 50. U.S. FDIhas doubled since 2002 to more than $22 billionin 2006. IT infrastructure development is equallystrong, as the country ranks 19th on the WorldEconomic Forum’s Network Readiness Index.JapanGDP: $4.4 trillion SCORE T 4EXPORTS: $666 billion8I 3IMPORTS: $571 billion P 2FDI (2006): $92 billion X -1FACTOR: Aging workforce, capacity andcongestion issuesA legacy in manufacturing innovation has pavedthe way for Japan’s status among the world’selite economies. Its high-tech and automotiveexport industries have helped shape a transportationnetwork that boasts seven ports amongthe world’s top 50 in cargo tonnage and threeairports that rank in the top 25 in terms of airfreightvolume. Japan’s government has becomemore aggressive in investing capital to diversifyindustry sectors after years of fiscal conservatismfollowing its economic bubble burst. U.S.direct investment is robust at more than $90 billionin 2006, second in Asia to Australia. Capacitylimitations, congestion, an aging workforce, andincreasing competition from other SoutheastAsian countries are unavoidable obstacles totrade expansion.TaiwanGDP: $376 billion SCORE T 3EXPORTS: $247 billion8I 3IMPORTS: $219 billion P 2FDI (2006): $16 billion X 0Taiwan’s sovereignty from China is a frequent topicof discussion and one that remains in question — toChina. Less obscure is the country’s economic wellbeing. With GDP growing at a five-percent clip andunemployment less than four percent, the island“republic” commands robust control over hightechmanufacturing and trade within the region. Aslabor-intensive manufacturing jobs migrate to themainland, Taiwan has successfully transitioned tomore value-added, technology-focused industries.On the transport side, Taipei serves as the cargo basefor EVA Airways and China Airlines and ranks 13th inthe world in cargo tonnage; the Port of Kaohsiung,which broke the 10-million-TEU plateau in 2007, isamong the world’s top-10 container ports.TIPTransportation InfrastructureInformation TechnologyPeople PowerSingaporeGDP: $154 billion SCORE T 4EXPORTS: $451 billion9I 3IMPORTS: $396 billion P 3FDI (2006): $60 billion X -1FACTOR: Southeast Asian competition andvulnerability to global economic shiftsThe MiddleEast & AsiaAs a former British trading colony, Singapore’s welleducated,English-speaking, transport-anchoredeconomy is perfectly adapted to global trade.Situated in close proximity to China and other burgeoningSoutheast Asian markets and trade lanes, itis arguably the world’s busiest and most developedcargo hub. Singapore’s port ranks number one globallyin container throughput and its airport is ninthin airfreight tonnage. On the downside, becauseSingapore is so intrinsically tied to global shifts indemand and supply and therefore economic recessions,the government is trying to create a morestable industrial base beyond technology manufacturingto include pharmaceuticals and other nichesectors.SPONSORED BYMarch 2008 • <strong>Inbound</strong> <strong>Logistics</strong>