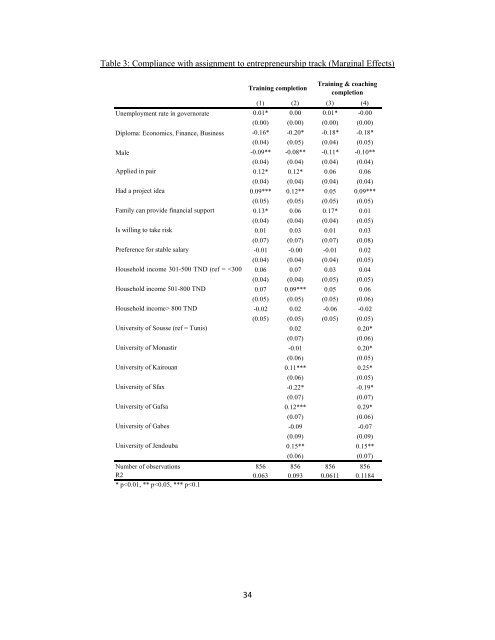
Table 3: Compliance with assignment to entrepreneurship track (Marginal Effects)(1) (2) (3) (4)Unemployment rate in governorate 0.01* 0.00 0.01* -0.00(0.00) (0.00) (0.00) (0.00)Diploma: <strong>Economic</strong>s, Finance, Business -0.16* -0.20* -0.18* -0.18*(0.04) (0.05) (0.04) (0.05)Male -0.09** -0.08** -0.11* -0.10**(0.04) (0.04) (0.04) (0.04)Applied in pair 0.12* 0.12* 0.06 0.06(0.04) (0.04) (0.04) (0.04)Had a project idea 0.09*** 0.12** 0.05 0.09***(0.05) (0.05) (0.05) (0.05)Family can provide financial support 0.13* 0.06 0.17* 0.01(0.04) (0.04) (0.04) (0.05)Is willing to take risk 0.01 0.03 0.01 0.03(0.07) (0.07) (0.07) (0.08)Preference for stable salary -0.01 -0.00 -0.01 0.02(0.04) (0.04) (0.04) (0.05)Household income 301-500 TND (ref = 800 TND -0.02 0.02 -0.06 -0.02(0.05) (0.05) (0.05) (0.05)University of Sousse (ref = Tunis) 0.02 0.20*(0.07) (0.06)University of Monastir -0.01 0.20*(0.06) (0.05)University of Kairouan 0.11*** 0.25*(0.06) (0.05)University of Sfax -0.22* -0.19*(0.07) (0.07)University of Gafsa 0.12*** 0.29*(0.07) (0.06)University of Gabes -0.09 -0.07(0.09) (0.09)University of Jendouba 0.15** 0.15**(0.06) (0.07)Number of observations 856 856 856 856R2 0.063 0.093 0.0611 0.1184* p
Table 4: Impacts on Employment OutcomesSpecification I Specification II Specification III(1) (2) (3) (4) (5) (6)N C T ITT St. Err TOT St. Err ITT St. Err TOT St. Err ITT St. Err TOT St. ErrA. Self-EmploymentSelf-employed in last 12 months 1,580 0.05 0.09 0.04*** 0.01 0.07*** 0.02 0.04*** 0.01 0.07*** 0.02 0.04*** 0.01 0.07*** 0.02Self-employed (any activity in last 7 days) 1,580 0.04 0.08 0.03** 0.01 0.05** 0.02 0.03** 0.01 0.05** 0.02 0.03** 0.01 0.05** 0.02Self-employed (excluding seasonal activities in last 7 days) 1,580 0.03 0.04 0.01* 0.01 0.02* 0.01 0.01* 0.01 0.02* 0.01 0.01 0.01 0.02 0.02B. Employment StatusEmployed in last 7 days 1,580 0.28 0.29 -0.00 0.02 -0.00 0.04 -0.00 0.02 -0.00 0.04 -0.00 0.03 -0.00 0.05Salaried worker in last 7 days 1,580 0.21 0.18 -0.03 0.02 -0.05 0.03 -0.03 0.02 -0.05* 0.03 -0.03* 0.02 -0.05* 0.03Self-employed (any activity in last 7 days) 1,580 0.04 0.08 0.03** 0.01 0.05** 0.02 0.03** 0.01 0.05** 0.02 0.03** 0.01 0.05** 0.02Unemployed in last 7 days 1,580 0.48 0.49 0.01 0.03 0.01 0.05 0.02 0.03 0.03 0.05 0.00 0.03 0.00 0.05Studying in last 7 days 1,580 0.19 0.18 -0.00 0.02 -0.01 0.03 -0.01 0.02 -0.02 0.03 0.00 0.02 0.00 0.03Inactive in last 7 days 1,580 0.03 0.03 0.01 0.01 0.01 0.01 -0.00 0.01 -0.00 0.01 0.01 0.01 0.01 0.02C. Characteristics of EmploymentHas contract 1,580 0.12 0.10 -0.02 0.02 -0.03 0.03 -0.02 0.02 -0.03 0.03 -0.02 0.02 -0.03 0.03Covered by Social Security 1,580 0.05 0.06 0.01 0.01 0.01 0.02 0.01 0.01 0.02 0.02 0.01 0.01 0.02 0.02Work in large firm 1,485 0.07 0.07 0.00 0.01 0.00 0.02 -0.00 0.01 -0.01 0.02 0.00 0.01 0.00 0.02Hours worked in last week 1,570 8.55 9.35 0.66 0.98 1.12 1.64 0.48 0.99 0.76 1.54 0.69 0.93 1.17 1.48Total labor earnings (monthly) 1,502 1.22 1.14 -0.06 0.13 -0.11 0.20 -0.08 0.13 -0.13 0.20 -0.06 0.12 -0.11 0.20Total labor earnings (monthly, log) 1,502 74.79 88.97 17.51 33.86 29.80 56.38 17.50 33.23 27.97 51.90 10.70 14.06 18.30 22.68Reservation wage for private sector job (monthly) 1,579 473.50 491.20 17.13* 8.73 28.85** 14.68 12.03 9.56 19.09 14.91 18.76* 9.96 31.69* 16.18Reservation wage for private sector job (log, monthly) 1,579 6.10 6.13 0.03* 0.02 0.06** 0.03 0.02 0.02 0.03 0.03 0.03* 0.02 0.06** 0.03Reservation wage for public sector job (monthly) 1,577 487.86 491.45 4.15 7.30 6.99 12.00 -1.25 8.44 -1.99 12.96 5.18 8.66 8.75 13.85Reservation wage for public sector job (log, monthly) 1,577 6.14 6.15 0.01 0.02 0.02 0.03 -0.00 0.02 -0.00 0.03 0.01 0.02 0.02 0.03D. Average effect size for impacts on Self-EmploymentSelf-employed in last 12 months 81% 136% 87% 138% 81% 138%Self-employed (any activity in last 7 days) 68% 114% 65% 104% 70% 119%Self-employed (excluding seasonal activities in last 7 days) 48% 81% 46% 74% 50% 85%Note: number of observation, average for control group, average for treatment group, intent-to-treat (ITT) estimates, standard errors for ITT estimates, treatment-on-the-treated (TOT) estimates for completingentrepreneurship training and attending coaching sessions, standard errors for TOT estimates. Standard errors clustered by strata in specification I and II, and by governorate in specification III.In all specifications controls include strata fixed-effects (by gender and 14 subjects), as well as a set of control variables from the baseline application form, including age at first job,previous experience in self-employment, prior experience with projects, prior experience in helping an entrepreneur and mother’s employment status.Controls in specification II also include baseling behavioral skills of the respondents at baseline (patience, willingness to take risk, impulsiveness, tenacity and sense of achievement).Sample size for Specification I and II: N=1,580. Sample Size for Specification III: N=1,432 (due to attrition in baseline phone survey)* significant at 10%. ** significant at 5%. *** significant at 1%.35