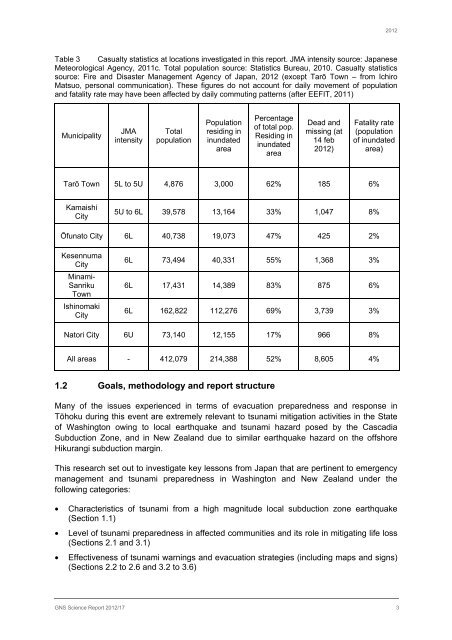
2012Table 3 Casualty statistics at locations investigated in this report. JMA intensity source: <strong>Japan</strong>eseMeteorological Agency, 2011c. Total population source: Statistics Bureau, 2010. Casualty statisticssource: Fire and Disaster Management Agency of <strong>Japan</strong>, 2012 (except Tarō Town – <strong>from</strong> IchiroMatsuo, personal communication). These figures do not account for daily movement of populationand fatality rate may have been affected by daily commuting patterns (after EEFIT, 2011)MunicipalityJMAintensityTotalpopulationPopulationresiding ininundatedareaPercentageof total pop.Residing ininundatedareaDead andmissing (at14 feb2012)Fatality rate(populationof inundatedarea)Tarō Town 5L to 5U 4,876 3,000 62% 185 6%KamaishiCity5U to 6L 39,578 13,164 33% 1,047 8%Ōfunato City 6L 40,738 19,073 47% 425 2%KesennumaCityMinami-SanrikuTownIshinomakiCity6L 73,494 40,331 55% 1,368 3%6L 17,431 14,389 83% 875 6%6L 162,822 112,276 69% 3,739 3%Natori City 6U 73,140 12,155 17% 966 8%All areas - 412,079 214,388 52% 8,605 4%1.2 Goals, methodology and report structureMany of <strong>the</strong> issues experienced in terms of <strong>evacuation</strong> preparedness and response inTōhoku during this event are extremely relevant to tsunami mitigation activities in <strong>the</strong> Stateof Washington owing to local earthquake and tsunami hazard posed by <strong>the</strong> CascadiaSubduction Zone, and in New Zealand due to similar earthquake hazard on <strong>the</strong> offshoreHikurangi subduction margin.This research set out to investigate key lessons <strong>from</strong> <strong>Japan</strong> that are pertinent to emergencymanagement and tsunami preparedness in Washington and New Zealand under <strong>the</strong>following categories:• Characteristics of tsunami <strong>from</strong> a high magnitude local subduction zone earthquake(Section 1.1)• Level of tsunami preparedness in affected communities and its role in mitigating life loss(Sections 2.1 and 3.1)• Effectiveness of tsunami warnings and <strong>evacuation</strong> strategies (including maps and signs)(Sections 2.2 to 2.6 and 3.2 to 3.6)GNS Science Report 2012/17 3
2012• Factors affecting emergency response (Sections 2.3 to 2.5 and 3.3 to 3.5), and• Performance of structures under earthquake shaking and subsequent tsunami loading,particularly those designed for/designated as vertical <strong>evacuation</strong> (Sections 2.7 and 3.7)The research was commissioned by Washington Military Department EmergencyManagement Division (Washington EMD) and supported by New Zealand Ministry ofScience and Innovation core geohazards funding to GNS Science, and was conducted incollaboration with local <strong>Japan</strong>ese colleagues. The report focusses on lessons forWashington and New Zealand.This report provides a reconnaissance-level analysis of <strong>the</strong> <strong>the</strong>mes which arose duringinterviews of disaster prevention officials and emergency services officials at seven tsunamiaffectedlocations in Iwate and Miyagi Prefectures. We discuss <strong>the</strong>se <strong>the</strong>mes in Section 2.0,and provide recommendations in Section 3.0 for fur<strong>the</strong>ring tsunami preparedness andmitigation in <strong>the</strong> Washington and in New Zealand. Interview data has been augmented withdiscussion of local maps, posters, reports, documents and signs in both <strong>Japan</strong>ese andEnglish. Appendices 1 and 2 show <strong>the</strong> interview questions in English and <strong>Japan</strong>ese andAppendix 3 gives a summary of <strong>the</strong> key points that were raised during interviews. Appendix4 provides a summary of vertical <strong>evacuation</strong> buildings in <strong>the</strong> locations visited, includinginformation on construction, signage, inundation on 11 th March, and number of people whotook refuge <strong>the</strong>re.1.3 InterviewsThe field survey was carried out <strong>from</strong> October 19 th to 28 th 2011 in collaboration with Mr IchiroMatsuo of NPO-CeMI, and Professor Hitomi Murakami of Yamaguchi University. Due to <strong>the</strong>timing of <strong>the</strong> survey 7 months after <strong>the</strong> tsunami, <strong>the</strong> interviews draw on information ga<strong>the</strong>redthrough many surveys carried out by local researchers in <strong>the</strong> interim period.Semi-structured interviews with city officials (civil protection, emergency management, firedepartment and police department staff) and some local residents were carried out in sevenlocations in Iwate and Miyagi Prefectures: Tarō Town, Kamaishi City, Ōfunato City,Kesennuma City, Minami-Sanriku Town, Ishinomaki City and Natori City. These locationscomprise variable topography of rias and plains, and among <strong>the</strong>m experienced a wide rangeof impacts and <strong>evacuation</strong> issues on March 11 th 2011. A map of <strong>the</strong> locations investigated ispresented in Figure 1 and a summary of casualty statistics is provided in Table 3.The focus of interviews was:• Natural and informal warnings: awareness, observations/experience and response• Style and derivation of <strong>evacuation</strong> maps• Official warning timing and dynamics• Evacuation timing, mechanisms and issues• Vertical <strong>evacuation</strong> buildings – availability, designation, public awareness, utilisation,relationship to maps, and post-event reviewGNS Science Report 2012/17 4