Some Aspects of Inter District Disparities in Tamil Nadu.
Some Aspects of Inter District Disparities in Tamil Nadu.
Some Aspects of Inter District Disparities in Tamil Nadu.

You also want an ePaper? Increase the reach of your titles
YUMPU automatically turns print PDFs into web optimized ePapers that Google loves.
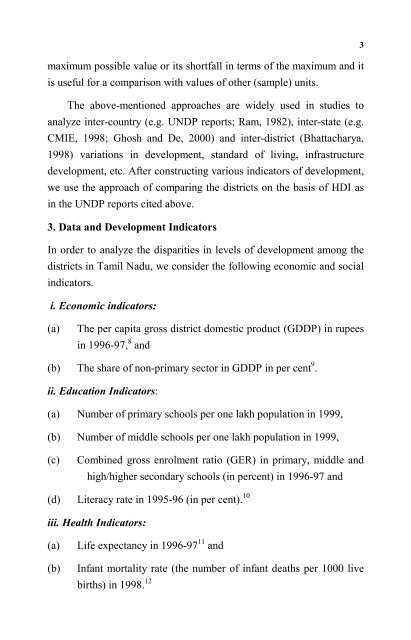
3maximum possible value or its shortfall <strong>in</strong> terms <strong>of</strong> the maximum and itis useful for a comparison with values <strong>of</strong> other (sample) units.The above-mentioned approaches are widely used <strong>in</strong> studies toanalyze <strong>in</strong>ter-country (e.g. UNDP reports; Ram, 1982), <strong>in</strong>ter-state (e.g.CMIE, 1998; Ghosh and De, 2000) and <strong>in</strong>ter-district (Bhattacharya,1998) variations <strong>in</strong> development, standard <strong>of</strong> liv<strong>in</strong>g, <strong>in</strong>frastructuredevelopment, etc. After construct<strong>in</strong>g various <strong>in</strong>dicators <strong>of</strong> development,we use the approach <strong>of</strong> compar<strong>in</strong>g the districts on the basis <strong>of</strong> HDI as<strong>in</strong> the UNDP reports cited above.3. Data and Development IndicatorsIn order to analyze the disparities <strong>in</strong> levels <strong>of</strong> development among thedistricts <strong>in</strong> <strong>Tamil</strong> <strong>Nadu</strong>, we consider the follow<strong>in</strong>g economic and social<strong>in</strong>dicators.i. Economic <strong>in</strong>dicators:(a)The per capita gross district domestic product (GDDP) <strong>in</strong> rupees<strong>in</strong> 1996-97, 8 and(b) The share <strong>of</strong> non-primary sector <strong>in</strong> GDDP <strong>in</strong> per cent 9 .ii. Education Indicators:(a) Number <strong>of</strong> primary schools per one lakh population <strong>in</strong> 1999,(b) Number <strong>of</strong> middle schools per one lakh population <strong>in</strong> 1999,(c)Comb<strong>in</strong>ed gross enrolment ratio (GER) <strong>in</strong> primary, middle andhigh/higher secondary schools (<strong>in</strong> percent) <strong>in</strong> 1996-97 and(d) Literacy rate <strong>in</strong> 1995-96 (<strong>in</strong> per cent). 10iii. Health Indicators:(a)(b)Life expectancy <strong>in</strong> 1996-97 11 andInfant mortality rate (the number <strong>of</strong> <strong>in</strong>fant deaths per 1000 livebirths) <strong>in</strong> 1998. 12
![Curriculum Vitae [pdf] - Madras School of Economics](https://img.yumpu.com/49878970/1/190x245/curriculum-vitae-pdf-madras-school-of-economics.jpg?quality=85)
![Curriculum Vitae [pdf] - Madras School of Economics](https://img.yumpu.com/48715201/1/184x260/curriculum-vitae-pdf-madras-school-of-economics.jpg?quality=85)