Ultrasensitive TNF-alpha ELISA - ALPCO Diagnostics
Ultrasensitive TNF-alpha ELISA - ALPCO Diagnostics
Ultrasensitive TNF-alpha ELISA - ALPCO Diagnostics

Create successful ePaper yourself
Turn your PDF publications into a flip-book with our unique Google optimized e-Paper software.
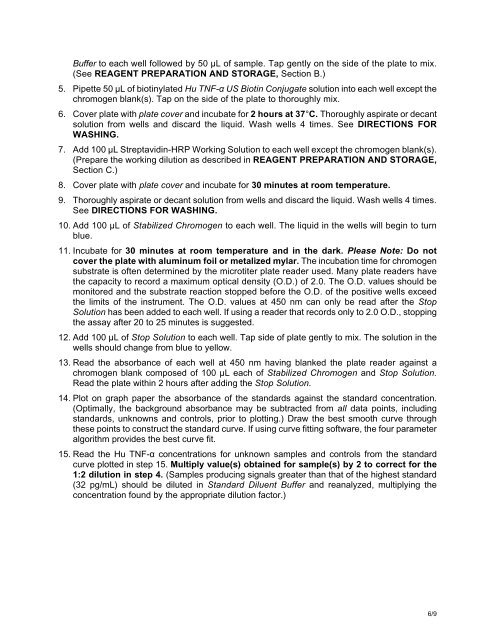
Buffer to each well followed by 50 µL of sample. Tap gently on the side of the plate to mix.(See REAGENT PREPARATION AND STORAGE, Section B.)5. Pipette 50 µL of biotinylated Hu <strong>TNF</strong>-α US Biotin Conjugate solution into each well except thechromogen blank(s). Tap on the side of the plate to thoroughly mix.6. Cover plate with plate cover and incubate for 2 hours at 37°C. Thoroughly aspirate or decantsolution from wells and discard the liquid. Wash wells 4 times. See DIRECTIONS FORWASHING.7. Add 100 µL Streptavidin-HRP Working Solution to each well except the chromogen blank(s).(Prepare the working dilution as described in REAGENT PREPARATION AND STORAGE,Section C.)8. Cover plate with plate cover and incubate for 30 minutes at room temperature.9. Thoroughly aspirate or decant solution from wells and discard the liquid. Wash wells 4 times.See DIRECTIONS FOR WASHING.10. Add 100 µL of Stabilized Chromogen to each well. The liquid in the wells will begin to turnblue.11. Incubate for 30 minutes at room temperature and in the dark. Please Note: Do notcover the plate with aluminum foil or metalized mylar. The incubation time for chromogensubstrate is often determined by the microtiter plate reader used. Many plate readers havethe capacity to record a maximum optical density (O.D.) of 2.0. The O.D. values should bemonitored and the substrate reaction stopped before the O.D. of the positive wells exceedthe limits of the instrument. The O.D. values at 450 nm can only be read after the StopSolution has been added to each well. If using a reader that records only to 2.0 O.D., stoppingthe assay after 20 to 25 minutes is suggested.12. Add 100 µL of Stop Solution to each well. Tap side of plate gently to mix. The solution in thewells should change from blue to yellow.13. Read the absorbance of each well at 450 nm having blanked the plate reader against achromogen blank composed of 100 µL each of Stabilized Chromogen and Stop Solution.Read the plate within 2 hours after adding the Stop Solution.14. Plot on graph paper the absorbance of the standards against the standard concentration.(Optimally, the background absorbance may be subtracted from all data points, includingstandards, unknowns and controls, prior to plotting.) Draw the best smooth curve throughthese points to construct the standard curve. If using curve fitting software, the four parameteralgorithm provides the best curve fit.15. Read the Hu <strong>TNF</strong>-α concentrations for unknown samples and controls from the standardcurve plotted in step 15. Multiply value(s) obtained for sample(s) by 2 to correct for the1:2 dilution in step 4. (Samples producing signals greater than that of the highest standard(32 pg/mL) should be diluted in Standard Diluent Buffer and reanalyzed, multiplying theconcentration found by the appropriate dilution factor.)6/9