Research Methods Handbook.pdf - CLES
Research Methods Handbook.pdf - CLES
Research Methods Handbook.pdf - CLES
You also want an ePaper? Increase the reach of your titles
YUMPU automatically turns print PDFs into web optimized ePapers that Google loves.
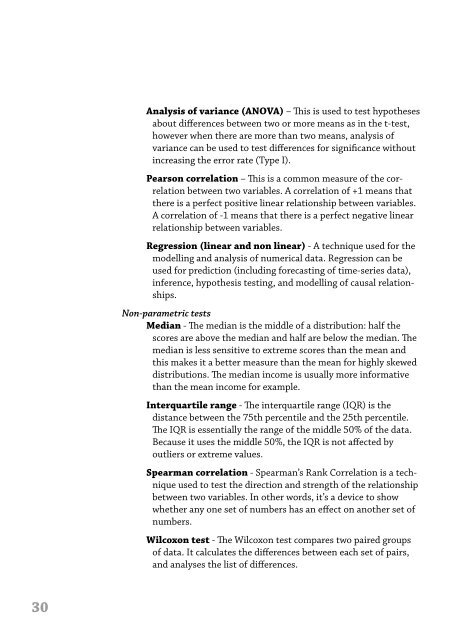
Analysis of variance (ANOVA) – This is used to test hypothesesabout differences between two or more means as in the t-test,however when there are more than two means, analysis ofvariance can be used to test differences for significance withoutincreasing the error rate (Type I).Pearson correlation – This is a common measure of the correlationbetween two variables. A correlation of +1 means thatthere is a perfect positive linear relationship between variables.A correlation of -1 means that there is a perfect negative linearrelationship between variables.Regression (linear and non linear) - A technique used for themodelling and analysis of numerical data. Regression can beused for prediction (including forecasting of time-series data),inference, hypothesis testing, and modelling of causal relationships.Non-parametric testsMedian - The median is the middle of a distribution: half thescores are above the median and half are below the median. Themedian is less sensitive to extreme scores than the mean andthis makes it a better measure than the mean for highly skeweddistributions. The median income is usually more informativethan the mean income for example.Interquartile range - The interquartile range (IQR) is thedistance between the 75th percentile and the 25th percentile.The IQR is essentially the range of the middle 50% of the data.Because it uses the middle 50%, the IQR is not affected byoutliers or extreme values.Spearman correlation - Spearman’s Rank Correlation is a techniqueused to test the direction and strength of the relationshipbetween two variables. In other words, it’s a device to showwhether any one set of numbers has an effect on another set ofnumbers.Wilcoxon test - The Wilcoxon test compares two paired groupsof data. It calculates the differences between each set of pairs,and analyses the list of differences.Mann-Whitney test - The Mann-Whitney test is a non-parametrictest for assessing whether two samples of observations comefrom the same distribution, testing the null hypothesis that theprobability of an observation from one population exceeds theprobability of an observation in a second population.Kruskal-Wallis test - A non-parametric method for testingequality of population medians among groups, using a one-wayanalysis of variance by ranks.Friedman test - The Friedman test is a nonparametric test thatcompares three or more paired groups.What is the output?The output of statistical analysis will depend on the statistical test youapply to your data, a detailed understanding of the test is required to beable to interpret the results. The output will most probably be furthertables of data, with a number of things being reported. It is importantto understand the information you need from a table of results, as youmay only require a single figure, but be presented with a range of informationwhich may be confusing if you are new to statistical analysis.How should it be analysed?Microsoft ExcelMicrosoft Excel includes a collection of statistical functions, within theadd-on Data Analysis ToolPak. Excel can analyse descriptive statisticsat a simple level and when used effectively, can be very useful in theexploratory analysis of data, cross tabulations (pivot charts), viewingdata in graphs to detect errors, unusual values, trends and patterns andsummarising data with means and standard deviations. However, Excelis of very limited use in the formal statistical analysis of data unlessyour experimental design is very simple. The Analysis ToolPak is also noeasier to use than more formal statistical packages, however there areplenty of guides and tutorials to be found on the internet.Formal Statistical Packages (SPSS, SAS, Stata)Inferential statistics are more often analysed in specialist statisticalpackages such as SPSS which provide greater functionality comparedto Excel. The package used by the researcher often depends on which30 31


