Briefing paper - Scottish Public Health Observatory
Briefing paper - Scottish Public Health Observatory
Briefing paper - Scottish Public Health Observatory

Create successful ePaper yourself
Turn your PDF publications into a flip-book with our unique Google optimized e-Paper software.
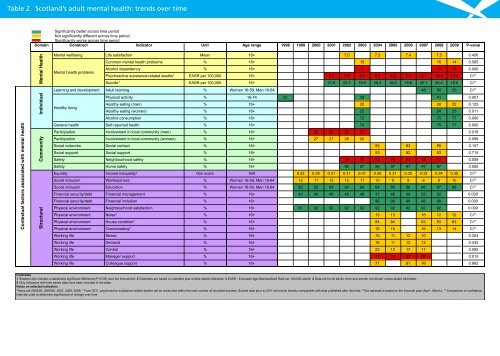
Table 2. Scotland’s adult mental health: trends over timeSignificantly better across time periodNot significantly different across time periodSignificantly worse across time periodDomain Construct Indicator UnitAge range 1998 1999 2000 2001 2002 2003 2004 2005 2006 2007 2008 2009P-valueContextual factors associated with mental healthStructural Community Individual Mental <strong>Health</strong>Mental wellbeing Life satisfaction MeanCommon mental health problems %Mental health problemsAlcohol dependency %Psychoactive substance-related deaths † EASR per 100,000Suicide † EASR per 100,000Learning and development Adult learning %Physical activity %<strong>Health</strong>y living<strong>Health</strong>y eating (men) %<strong>Health</strong>y eating (women) %Alcohol consumption %General health Self-reported health %Participation Involvement in local community (men) %Participation Involvement in local community (women) %Social networks Social contact %Social support Social support %Safety Neighbourhood safety %Safety Home safety %Equality Income inequality ‡ Gini scoreSocial inclusion Worklessness %Social inclusion Education %Financial security/debt Financial management %Financial security/debt Financial inclusion %Physical environment Neighbourhood satisfaction %Physical environment Noise* %Physical environment House condition* %Physical environment Overcrowding* %16+ 7.0 7.3 7.4 7.516+ 15 15 1416+ 8 11 1016+ 6.2 7.8 6.1 6.5 5.6 7.7 8.1 10.3 10.416+ 21.9 22.3 19.6 20.4 18.6 18.6 20.1 20.4 18.0Women 16-59, Men 16-64 48 50 5016-74 32 39 4116+ 20 20 2216+ 22 24 2516+ 72 75 7716+ 74 75 7716+ 24 24 24 2116+ 27 27 28 2816+ 83 83 8516+ 83 82 8316+ 73 75 74 75 74 73 7216+ 96 97 96 97 97 97 97N/A 0.33 0.34 0.31 0.31 0.31 0.30 0.31 0.32 0.33 0.34 0.35Women 16-59, Men 16-64 12 11 12 12 11 10 9 9 8 9 10Women 16-59, Men 16-64 82 82 83 84 84 84 85 86 86 87 8816+ 42 40 46 48 46 47 46 49 53 5216+ 96 98 98 98 9816+ 91 92 92 92 92 92 92 92 92 9216+ 13 13 16 12 1216+ 84 84 83 83 8316+ 16 16 16 13 140.4560.5650.000CI ††CI ††CI ††0.0070.1250.0110.0000.0000.0180.0990.1570.7150.0090.000CI ††CI ††CI ††0.0000.0000.000CI ††CI ††CI ††Working life Stress %16+ 15 11 12 100.204Working life Demand %16+ 16 11 12 120.435Working life Control %16+ 23 12 17 170.592Working life Manager support %16+ 74 75 63 620.012Working life Colleague support %16+ 77 81 760.982Footnotes1 Shaded cells indicate a statistically significant difference (P