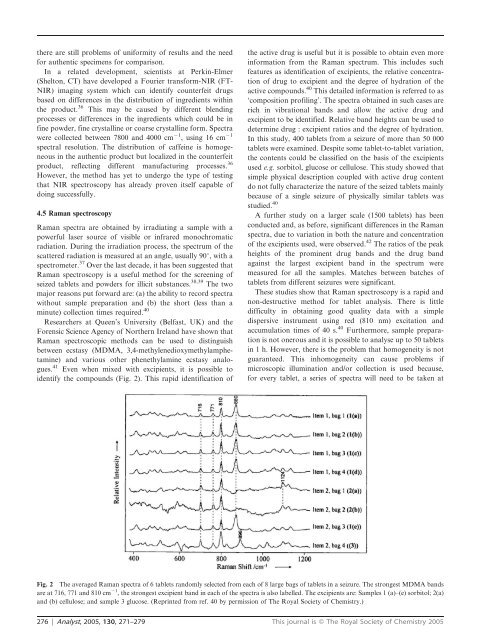
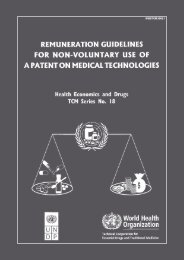
there are still problems of uniformity of results and the needfor authentic specimens for comparison.In a related development, scientists at Perkin-Elmer(Shelton, CT) have developed a Fourier transform-NIR (FT-NIR) imaging system which can identify counterfeit drugsbased on differences in the distribution of ingredients withinthe product. 36 This may be caused by different blendingprocesses or differences in the ingredients which could be infine powder, fine crystalline or coarse crystalline form. Spectrawere collected between 7800 and 4000 cm 21 , using 16 cm 21spectral resolution. The distribution of caffeine is homogeneousin the authentic product but localized in the counterfeitproduct, reflecting different manufacturing processes. 36However, the method has yet to undergo the type of testingthat NIR spectroscopy has already proven itself capable ofdoing successfully.4.5 Raman spectroscopyRaman spectra are obtained by irradiating a sample with apowerful laser source of visible or infrared monochromaticradiation. During the irradiation process, the spectrum of thescattered radiation is measured at an angle, usually 90u, with aspectrometer. 37 Over the last decade, it has been suggested thatRaman spectroscopy is a useful method for the screening ofseized tablets and powders for illicit substances. 38,39 The twomajor reasons put forward are: (a) the ability to record spectrawithout sample preparation and (b) the short (less than aminute) collection times required. 40Researchers at Queen’s University (Belfast, UK) and theForensic Science Agency of Northern Ireland have shown thatRaman spectroscopic methods can be used to distinguishbetween ecstasy (MDMA, 3,4-methylenedioxymethylamphetamine)and various other phenethylamine ecstasy analogues.41 Even when mixed with excipients, it is possible toidentify the compounds (Fig. 2). This rapid identification ofthe active drug is useful but it is possible to obtain even moreinformation from the Raman spectrum. This includes suchfeatures as identification of excipients, the relative concentrationof drug to excipient and the degree of hydration of theactive compounds. 40 This detailed information is referred to as‘composition profiling’. The spectra obtained in such cases arerich in vibrational bands and allow the active drug andexcipient to be identified. Relative band heights can be used todetermine drug : excipient ratios and the degree of hydration.In this study, 400 tablets from a seizure of more than 50 000tablets were examined. Despite some tablet-to-tablet variation,the contents could be classified on the basis of the excipientsused e.g. sorbitol, glucose or cellulose. This study showed thatsimple physical description coupled with active drug contentdo not fully characterize the nature of the seized tablets mainlybecause of a single seizure of physically similar tablets wasstudied. 40A further study on a larger scale (1500 tablets) has beenconducted and, as before, significant differences in the Ramanspectra, due to variation in both the nature and concentrationof the excipients used, were observed. 42 The ratios of the peakheights of the prominent drug bands and the drug bandagainst the largest excipient band in the spectrum weremeasured for all the samples. Matches between batches oftablets from different seizures were significant.These studies show that Raman spectroscopy is a rapid andnon-destructive method for tablet analysis. There is littledifficulty in obtaining good quality data with a simpledispersive instrument using red (810 nm) excitation andaccumulation times of 40 s. 40 Furthermore, sample preparationis not onerous and it is possible to analyse up to 50 tabletsin 1 h. However, there is the problem that homogeneity is notguaranteed. This inhomogeneity can cause problems ifmicroscopic illumination and/or collection is used because,for every tablet, a series of spectra will need to be taken atFig. 2 The averaged Raman spectra of 6 tablets randomly selected from each of 8 large bags of tablets in a seizure. The strongest MDMA bandsare at 716, 771 and 810 cm 21 , the strongest excipient band in each of the spectra is also labelled. The excipients are: Samples 1 (a)–(e) sorbitol; 2(a)and (b) cellulose; and sample 3 glucose. (Reprinted from ref. 40 by permission of The Royal Society of Chemistry.)276 | Analyst, 2005, 130, 271–279 This journal is ß The Royal Society of Chemistry 2005
different points on the surface to ensure the data arerepresentative of the composition of the sample. 41 Althoughcontrolled substances are considered here rather than pharmaceuticals,it is proposed that Raman spectroscopy willbecome more widely used in the pharmaceutical industry as thenumber of <strong>counterfeiting</strong> incidents increases.4.6 TensiographyTensiography is a recently developed technique in which aforming pendant drop is illuminated from within by an opticfibre generator and receiver. The technique provides fingerprinttraces whose profiles depend on surface tension,refractive index and colour amongst other parameters. 43Tensiography allows a solution of the active molecule to becontinuously sampled thus providing a continuous flow ofinformation as the molecule passes into solution. By fingerprintingeach product, the technique is capable of differentiatingone supplier of drugs from another and, also, one batchfrom another. 43 Brian O’Rourke at the Institute of TechnologyCarlow (Republic of Ireland) is currently focusing on thedetection of counterfeit penicillins by tensiography.4.7 Isotopic characterisationIt has been suggested that natural stable isotopic ‘fingerprints’of pharmaceuticals can be used as a specific method fordetecting counterfeits. 44 Since stable isotopes are nonradioactiveand exist naturally in drugs and other materials,no external reagents are required. This makes the proceduresimple and attractive to the end-user. A study of four analgesiccompounds indicated that individual batches of each drugcould be identified on the basis of their bulk isotopicfingerprints. The samples were powdered and their 18 O/ 16 O,D/H and 13 C ratios were measured by continuous flowconbustion/pyrolysis isotope ratio mass spectrometry. 44Jasper has reported that the specificity of the technique issimilar to that of DNA identification. 45 It has been claimedthat isotopic product authenticity is currently accepted byresearchers and that it is slowly gaining acceptance by qualityassurance officials and pharmaceutical companies. 44 This typeof identification allows manufacturers to minimize <strong>counterfeiting</strong>,counter-trading and theft because it is very expensiveto counterfeit the specific isotopic composition of specificdrugs. 46V. Anti-<strong>counterfeiting</strong> measuresMost of the anti-<strong>counterfeiting</strong> measures employed by thepharmaceutical manufacturers are concerned with maintainingauthenticity of their products. Authentication can be dividedinto three categories: 47 (i) overt security features which areapparent and visible and do not require instruments to detectthem, (ii) covert features which are hidden, not immediatelyapparent and which require a simple instrument (e.g. UVlamp, magnifier) to identify them and (iii) forensic levelfeatures which are very secret and are present on a ‘need toknow’ basis only. These may include the addition of a taggantmaterial or changes to a substrate or print which requiresspecialized instrumentation to detect them.Table 3 gives examples of each type of authenticationcategory. Several of these approaches will be described to givean overview of the methods which are currently employed.5.1 HologramsThe use of holograms and security print features as a means ofconfirming genuine products has grown rapidly over the lastdecade. 48 Holograms are generated from the interferencepatterns obtained through the interaction of laser beams.The complexity of origination varies from the traditional 3Dimage to computer generated 2D-diffraction patterns. 48Currently available security holograms produce 2D–3Ddesigns, where different planes of 2D artwork will be visibleat different angles.Holograms are now widely available in a variety of formatssuch as: 49 (i) holographic shrink sleeves to protect brandedbottled products against <strong>counterfeiting</strong> and refilling, (ii) blisterpackaging aluminium foil, (iii) pharmaceutical PVC, where thehologram is applied as a thin stripe to PVC sheets used tomake blister packs, (iv) holographic induction cap seals, (v)polyester-based tamper evident labels used to seal packagesand (vi) holographic hot stamping foil where the hologram isfused to the host surface by heat and pressure.Advantages to the use of security holograms include thefollowing: 10 (i) they are difficult to counterfeit, (ii) they arerecognizable to the consumer, (iii) they can feature covert toolssuch as nanoimagery, micro-imagery, digital watermarks andhidden images, (iv) they are relatively cheap and (v) they allowthe tracing/tracking of products through the distributionchain.5.2 Tracers, taggants and inksAdditions of chemical and biological tracers to the packagingand/or product has been relatively commonplace as an anti<strong>counterfeiting</strong>measure. According to Prebble, 48 ‘‘verificationranges from simple to complex, with certain paper systemsauthenticated using specially developed colour change pens.’’With respect to inks, many types are available and theseTable 3 Examples of authentication features 47Overt Covert ForensicOptically variable coatings which change colourwhen viewing angle is changedMicroscopic particles of specific colours Addition of low concentrations (ppm)of a taggantHolographic foils Labels printed with colour combinations Identifying the isotopic compositionof naturally occurring materialsThermochromic inks and coatings Holograms containing microtext IR analysisWatermarksInclusions with characteristicspectroscopic propertiesAdditions of DNA fragments toproducts and packagingThis journal is ß The Royal Society of Chemistry 2005 Analyst, 2005, 130, 271–279 | 277