Right-Wing Authoritarianism and Prejudice 1 RIGHT-WING ...
Right-Wing Authoritarianism and Prejudice 1 RIGHT-WING ...
Right-Wing Authoritarianism and Prejudice 1 RIGHT-WING ...

You also want an ePaper? Increase the reach of your titles
YUMPU automatically turns print PDFs into web optimized ePapers that Google loves.
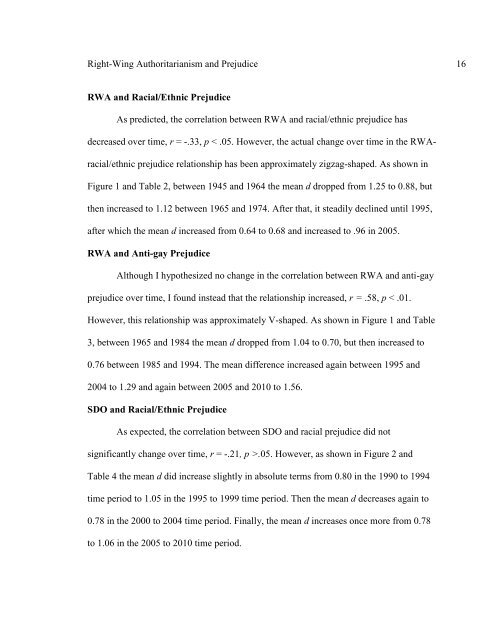
<strong>Right</strong>-<strong>Wing</strong> <strong>Authoritarianism</strong> <strong>and</strong> <strong>Prejudice</strong> 16RWA <strong>and</strong> Racial/Ethnic <strong>Prejudice</strong>As predicted, the correlation between RWA <strong>and</strong> racial/ethnic prejudice hasdecreased over time, r = -.33, p < .05. However, the actual change over time in the RWAracial/ethnicprejudice relationship has been approximately zigzag-shaped. As shown inFigure 1 <strong>and</strong> Table 2, between 1945 <strong>and</strong> 1964 the mean d dropped from 1.25 to 0.88, butthen increased to 1.12 between 1965 <strong>and</strong> 1974. After that, it steadily declined until 1995,after which the mean d increased from 0.64 to 0.68 <strong>and</strong> increased to .96 in 2005.RWA <strong>and</strong> Anti-gay <strong>Prejudice</strong>Although I hypothesized no change in the correlation between RWA <strong>and</strong> anti-gayprejudice over time, I found instead that the relationship increased, r = .58, p < .01.However, this relationship was approximately V-shaped. As shown in Figure 1 <strong>and</strong> Table3, between 1965 <strong>and</strong> 1984 the mean d dropped from 1.04 to 0.70, but then increased to0.76 between 1985 <strong>and</strong> 1994. The mean difference increased again between 1995 <strong>and</strong>2004 to 1.29 <strong>and</strong> again between 2005 <strong>and</strong> 2010 to 1.56.SDO <strong>and</strong> Racial/Ethnic <strong>Prejudice</strong>As expected, the correlation between SDO <strong>and</strong> racial prejudice did notsignificantly change over time, r = -.21, p >.05. However, as shown in Figure 2 <strong>and</strong>Table 4 the mean d did increase slightly in absolute terms from 0.80 in the 1990 to 1994time period to 1.05 in the 1995 to 1999 time period. Then the mean d decreases again to0.78 in the 2000 to 2004 time period. Finally, the mean d increases once more from 0.78to 1.06 in the 2005 to 2010 time period.