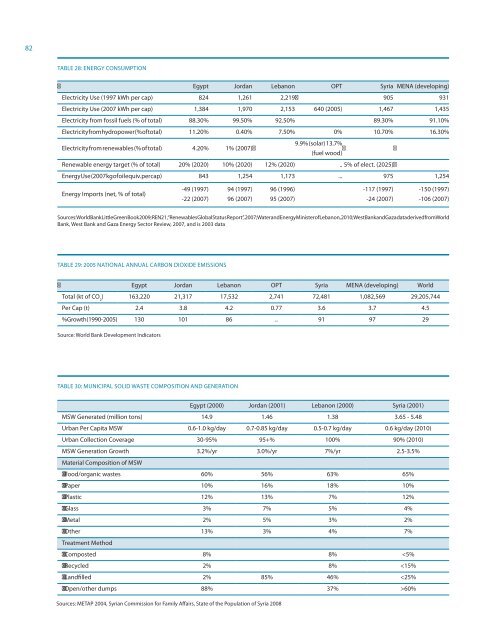
82TABLE 28: ENERGY CONSUMPTIONEgypt Jordan Lebanon OPT Syria MENA (developing)Electricity Use (1997 kWh per cap) 824 1,261 2,219 905 931Electricity Use (2007 kWh per cap) 1,384 1,970 2,153 640 (2005) 1,467 1,435Electricity from fossil fuels (% <strong>of</strong> total) 88.30% 99.50% 92.50% 89.30% 91.10%Electricity from hydropower (% <strong>of</strong> total) 11.20% 0.40% 7.50% 0% 10.70% 16.30%Electricity from renewables (% <strong>of</strong> total) 4.20% 1% (2007)9.9% (solar) 13.7%(fuel wood)Renewable energy target (% <strong>of</strong> total) 20% (2020) 10% (2020) 12% (2020) .. 5% <strong>of</strong> elect. (2025)Energy Use (2007 kg <strong>of</strong> oil equiv. per cap) 843 1,254 1,173 ... 975 1,254Energy Imports (net, % <strong>of</strong> total)-49 (1997)-22 (2007)94 (1997)96 (2007)96 (1996)95 (2007)-117 (1997)-24 (2007)-150 (1997)-106 (2007)Sources: World Bank Little Green Book 2009; REN21, “Renewables Global Status Report”, 2007; Water and Energy Minister <strong>of</strong> Lebanon, 2010; West Bank and Gaza data derived from WorldBank, West Bank and Gaza Energy Sector Review, 2007, and is 2003 dataTABLE 29: 2005 NATIONAL ANNUAL CARBON DIOXIDE EMISSIONSEgypt Jordan Lebanon OPT Syria MENA (developing) WorldTotal (kt <strong>of</strong> CO 2) 163,220 21,317 17,532 2,741 72,481 1,082,569 29,205,744Per Cap (t) 2.4 3.8 4.2 0.77 3.6 3.7 4.5% Growth (1990-2005) 130 101 86 .. 91 97 29Source: World Bank Development IndicatorsTABLE 30: MUNICIPAL SOLID WASTE COMPOSITION AND GENERATIONEgypt (2000) Jordan (2001) Lebanon (2000) Syria (2001)MSW Generated (million tons) 14.9 1.46 1.38 3.65 - 5.48Urban Per Capita MSW 0.6-1.0 kg/day 0.7-0.85 kg/day 0.5-0.7 kg/day 0.6 kg/day (2010)Urban Collection Coverage 30-95% 95+% 100% 90% (2010)MSW Generation Growth 3.2%/yr 3.0%/yr 7%/yr 2.5-3.5%Material Composition <strong>of</strong> MSWFood/organic wastes 60% 56% 63% 65%Paper 10% 16% 18% 10%Plastic 12% 13% 7% 12%Glass 3% 7% 5% 4%Metal 2% 5% 3% 2%Other 13% 3% 4% 7%Treatment MethodComposted 8% 8%
83TABLE 31: GOVERNMENT RESPONSIBILITY FOR URBAN SERVICESMacro Policy / Oversight Financing ProvisionFunction Egypt OPT World Egypt OPT World Egypt OPT WorldSocial ServicesSocial Welfare C C C C C C C C C,P,MHospitals C C C C C C,P,M C C C,P,MPublic Health C C C,P C C C,P,M C C C,P,MUniversities C C C,P C C C,P,M C C C,P,MSecondary Education C C C,P C C C,P,M C C C,P,MPrimary Education C C C,P C C C,P,M C C C,P,MHousing C C C,P C C C,P,M C C C,P,MTransportationUrban Transport C,P C,P,M C,P,M C,P,M C,P,M C,P,M C,P C,P,M C,P,MRailroads C n/a C,P C n/a C,P C n/a C,P,MAirports C n/a C,P C n/a C,P C n/a C,P,MPorts & Waterways C n/a C C n/a C C n/a C,P,MUrban Highways C,P C,P,M C,P,M C,P,M C,P,M C,P,M C,P C,P,M C,P,MInterurban Highways C,P C,P,M C,P C,P C,P,M C,P C,P C,P,M C,P,MUtility ServicesElectricity C C C,P,M C M C,P,M C C C,P,MWaste Collection M M M M M M M M MWater & Sewerage P,M M M P,M M M P,M M MOther ServicesFire Protection M C,P,M M M C,P,M M M C,P,M MHeating n/a n/a M n/a n/a M n/a n/a MIrrigation C,P C,P M C,P C,P M C,P C,P MPolice C C C,P,M C C C,P,M C C C,P,MC = Central Government, P = Provincial Government, M = Municipal Government, n/a = Not Applicable; Source: Tosun and Yilmaz, 2008TABLE 32: PARTICIPATION IN THE WORKFORCE AND NATIONAL POLITICS BY WOMEN/MEN IN THE MASHREQEgypt Iraq Jordan Lebanon Palestine Syria♀ ♂ ♀ ♂ ♀ ♂ ♀ ♂ ♀ ♂ ♀ ♂Literacy rate (% literate aged 15 and above, 2006-08) 58 75 69 86 89 95 86 93 91 97 77 90Labour Force Participation Rate (% <strong>of</strong> those aged 15-64employed, 2008)24 76 14 72 25 78 24 75 17 72 22 82% <strong>of</strong> Unemployment (2008) 19 6 13* 10* 24 10 .. .. 24 26 21^ 8^% <strong>of</strong> parliament (single or lower house) female (2009) 2 (quota: 12) 26 6 3 12% <strong>of</strong> ministerial positions held by women (2005) 6 19 11 7 6% <strong>of</strong> overall legislators, senior <strong>of</strong>ficials and managers whoare women (2007/2008)11 8 10 10Source: World Bank Gender Statistics, UN Division <strong>of</strong> Statistics, UN HDR 2009; *2004 data; ^2003 data
- Page 1 and 2:
The State ofArab Cities 2012 / 2013
- Page 3 and 4:
The State ofArab Cities 2012 / 2013
- Page 5 and 6:
Foreword by UN-HabitatIIIIt gives m
- Page 7 and 8:
ContentsVMessage from the Secretary
- Page 9 and 10:
The Arab States Region: Key Finding
- Page 11 and 12:
IXSana’a, Yemen, is one of the ol
- Page 13 and 14:
XIRegional Subdivision and Sub-Regi
- Page 15 and 16:
1.1Summaries of Sub-regional Sectio
- Page 17 and 18:
3▲Amman, Jordan. In Jordan, 16 pe
- Page 19 and 20:
5Qatar. Housing finance in Gulf cou
- Page 21 and 22:
7Southern Tier Regional SummaryPopu
- Page 23 and 24:
1.2Historical Perspectives9Jerash,
- Page 25 and 26:
11BOX 1: THE SOUL AND IDENTITY OF T
- Page 27 and 28:
13Their location often still reflec
- Page 29 and 30:
15Given the rapidly-increasing gap
- Page 31 and 32:
1.5Refugees and IDPs17Most of the c
- Page 33 and 34:
19FIGURE 5: RENEWABLE WATER AVAILAB
- Page 35 and 36:
1.7Regional Corridors and Cooperati
- Page 37 and 38:
23The impacts of civil unrest made
- Page 39 and 40:
Statistical Annex25TABLE 2: ARAB RE
- Page 41 and 42:
27TABLE 8: YOUTH UNEMPLOYMENT AS A
- Page 43 and 44:
29TABLE 11: AVERAGE ANNUAL GROWTH R
- Page 45 and 46: 31ENDNOTES1Unless otherwise noted,
- Page 47 and 48: 2.1Population and Urbanization33Tot
- Page 49 and 50: 35FIGURE 10: ALEPPO VISION PLANPhas
- Page 51 and 52: 37FIGURE 12: LEBANON NATIONAL MASTE
- Page 53 and 54: 39FIGURE 13: ECONOMIC ACTIVITIES IN
- Page 55 and 56: 41Najaf, Iraq. Iraqi men survey the
- Page 57 and 58: 43BOX 5: IRAQI REFUGEES IN SYRIASin
- Page 59 and 60: 45FIGURE 14: GEOGRAPHIC INEQUALITIE
- Page 61 and 62: 47School children walk home after a
- Page 63 and 64: 49BOX 6: URBAN BAGHDAD: IMPACT OF C
- Page 65 and 66: 51BOX 8: ISLAMIC HOUSING FINANCEIsl
- Page 67 and 68: 53BOX 9: EGYPT’S INFORMAL SETTLEM
- Page 69 and 70: 55In Greater Cairo, 62 per cent of
- Page 71 and 72: Tripoli, Lebanon. Prolonged conflic
- Page 73 and 74: 2.4Urban Mobility59The Challenge of
- Page 75 and 76: 2.5Urban Environmental Challenges61
- Page 77 and 78: 63The growing cost of energy will a
- Page 79 and 80: 65TABLE 18: PROPORTION OF POOR IN U
- Page 81 and 82: 67Solid Waste ManagementBy 2001, so
- Page 83 and 84: 69In Iraq, there is no national urb
- Page 85 and 86: 71Only the OPT has a truly decentra
- Page 87 and 88: 73approximately USD 7.1 billion in
- Page 89 and 90: 75FIGURE 21: URBAN CLUSTERING ALONG
- Page 91 and 92: 77Establishing a regional electrica
- Page 93 and 94: Mashreq Statistical Annex79TABLE 20
- Page 95: 81TABLE 25: LEVEL OF MOTORIZATION I
- Page 99 and 100: 85ENDNOTES1World Bank. (2009). Worl
- Page 101 and 102: 87ENDNOTES181Rishmawi, M. and T. Mo
- Page 103 and 104: 3.1Population and Urbanization89The
- Page 105 and 106: 91Fes, Morocco. Morocco has managed
- Page 107 and 108: 93TABLE 35: TUNISIA’S ECONOMY BY
- Page 109 and 110: 95Madrasah pupils in Mauritania whe
- Page 111 and 112: 3.3Urban Development and Housing Co
- Page 113 and 114: 99BOX 13: RETURNING TO THE COMPACT
- Page 115 and 116: 101BOX 14: MAURITANIA’S TWIZÉ PR
- Page 117 and 118: Photos: Rasna Warah, Olav Saltbones
- Page 119 and 120: 3.4 Urban Mobility105The Société
- Page 121 and 122: 107Algiers will launch a metro syst
- Page 123 and 124: 109TABLE 39: DOMESTIC WATER TARIFFS
- Page 125 and 126: 111Isofoton photovoltaic micro-plan
- Page 127 and 128: 3.6 Urban Governance Systems113Nati
- Page 129 and 130: 115Local woman in the medina of the
- Page 131 and 132: 11729 wishing to emigrate rose from
- Page 133 and 134: 119FIGURE 33: EURO-MED TRANSPORT PR
- Page 135 and 136: Maghreb Statistical Appendix121TABL
- Page 137 and 138: 123TABLE 47: LEVEL OF MOTORIZATION
- Page 139 and 140: 125TABLE 54: DESTINATIONS OF EMIGRA
- Page 141 and 142: 127ENDNOTESDevelopment, 2010. Also,
- Page 143 and 144: 4.1Population and Urbanization129Th
- Page 145 and 146: 131FIGURE 37: THE DIYAR AL MUHARRAQ
- Page 147 and 148:
4.2The Growing Economic Role of Cit
- Page 149 and 150:
135research,whileprovidingasolidinf
- Page 151 and 152:
137BOX 17: IMPACTS OF THE GLOBAL FI
- Page 153 and 154:
139FIGURE 39: DEVELOPMENT OF SECOND
- Page 155 and 156:
141immigrant labourers, the Saudi p
- Page 157 and 158:
143The wind tower of Sheikh Isa bin
- Page 159 and 160:
145multi-story residential building
- Page 161 and 162:
147Low cost migrant housing in Deir
- Page 163 and 164:
149TABLE 59: PERCENTAGE OF URBAN PO
- Page 165 and 166:
4.4Urban Mobility151The Challenges
- Page 167 and 168:
153Mass TransportationUnique among
- Page 169 and 170:
155BOX 21: RESPONSES TO WATER SHORT
- Page 171 and 172:
157FIGURE 44: GCC REGIONAL CLIMATE
- Page 173 and 174:
159FIGURE 46: PARTICULATE MATTER (P
- Page 175 and 176:
161systems, liveability, water, ene
- Page 177 and 178:
163local development and infrastruc
- Page 179 and 180:
4.7Migration and Remittances165Cons
- Page 181 and 182:
167One of the reasons that the effo
- Page 183 and 184:
169FIGURE 48: THE GULF PENINSULA’
- Page 185 and 186:
171BOX 23: ARAB GULF STATES COOPERA
- Page 187 and 188:
173FIGURE 50: PLANNED REGIONAL GCC
- Page 189 and 190:
175TABLE 62: AVERAGE ANNUAL RATE OF
- Page 191 and 192:
177TABLE 70: WATER AVAILABILITY AND
- Page 193 and 194:
179TABLE 76: IMMIGRATION DATA BY CO
- Page 195 and 196:
181ENDNOTESStatistical Abstract: 20
- Page 197 and 198:
183ENDNOTES276ITUC CSI IGB (2009),
- Page 199 and 200:
5.1Population and Urbanization185Th
- Page 201 and 202:
0-1ComorosDjiboutiSomaliaSudanYemen
- Page 203 and 204:
5.2The Growing Economic Role of Cit
- Page 205 and 206:
191infrastructure development, 71 a
- Page 207 and 208:
5.3Urban Development and Housing Co
- Page 209 and 210:
195In Djibouti, where almost all ma
- Page 211 and 212:
5.4Urban Mobility197The Challenge o
- Page 213 and 214:
5.5Urban Environmental Challenges19
- Page 215 and 216:
201Water vendor in Khartoum, Sudan.
- Page 217 and 218:
203million people in Sudan, particu
- Page 219 and 220:
5.6Urban Governance System205Bab al
- Page 221 and 222:
207Of the three regions, Somaliland
- Page 223 and 224:
209measures to strengthen instituti
- Page 225 and 226:
211International Migration of Refug
- Page 227 and 228:
Southern Tier Statistical Appendix2
- Page 229 and 230:
215TABLE 86: LEVEL OF MOTORIZATION
- Page 231 and 232:
217TABLE 93: EMIGRATION AND IMMIGRA
- Page 233 and 234:
219ENDNOTESAssessment, Issue Brief
- Page 235 and 236:
Bibliography221$500 Million Mortgag
- Page 237 and 238:
223Choplin, A., ‘Répondre au dé
- Page 239 and 240:
225Ghzala, A., “Regional Cross-Bo
- Page 241 and 242:
227__, (ed.), ‘Architecture and t
- Page 243 and 244:
229‘Sana’a: a City Development
- Page 245 and 246:
231__. City Development Strategy fo
- Page 247:
The Arab world has played a very im