A framework for supply chain performance measurement
A framework for supply chain performance measurement
A framework for supply chain performance measurement

Create successful ePaper yourself
Turn your PDF publications into a flip-book with our unique Google optimized e-Paper software.
ARTICLE IN PRESSInt. J. Production Economics 87 (2004) 333–347A <strong>framework</strong> <strong>for</strong> <strong>supply</strong> <strong>chain</strong> per<strong>for</strong>mance <strong>measurement</strong>A. Gunasekaran a, *, C. Patel b , Ronald E. McGaughey ca Department of Business Administration, University of Illinois at Springfield, One University Plaza, Springfield, IL 62703-5407, USAb Ace InfoTech, Inc., 406 Wellington Drive, Streamwood, IL 60107, USAc Department of Management In<strong>for</strong>mation Systems, The University of Central Arkansas, Conway, AR 72035-0001, USAAbstractSupply <strong>chain</strong> management (SCM) has been a major component of competitive strategy to enhance organizationalproductivity and profitability. The literature on SCM that deals with strategies and technologies <strong>for</strong> effectivelymanaging a <strong>supply</strong> <strong>chain</strong> is quite vast. In recent years, organizational per<strong>for</strong>mance <strong>measurement</strong> and metrics havereceived much attention from researchers and practitioners. The role of these measures and metrics in the success of anorganization cannot be overstated because they affect strategic, tactical and operational planning and control.Per<strong>for</strong>mance <strong>measurement</strong> and metrics have an important role to play in setting objectives, evaluating per<strong>for</strong>mance,and determining future courses of actions. Per<strong>for</strong>mance <strong>measurement</strong> and metrics pertaining to SCM have not receivedadequate attention from researchers or practitioners. We developed a <strong>framework</strong> to promote a better understanding ofthe importance of SCM per<strong>for</strong>mance <strong>measurement</strong> and metrics. Using the current literature and the results of anempirical study of selected British companies, we developed the <strong>framework</strong> presented herein, in hopes that it wouldstimulate more interest in this important area.r 2003 Elsevier B.V. All rights reserved.Keywords: Supply <strong>chain</strong>; Per<strong>for</strong>mance <strong>measurement</strong>s; Metrics; Empirical analysis; Framework1. IntroductionBy the late 1980s, outsourcing in US industriescontributed to nearly 60% of the total productcost (Ballou, 1992). In the UK, a survey showedthat 40% of the UK’s gross domestic product wasspent on distribution and logistics related activities(Department of Trade and Industry, UK, 1990).Such findings and developments present significantvisible impact of distribution, purchasing, and<strong>supply</strong> management on company assets. Managers*Corresponding author. Tel.: +1-217-206-7927; fax: +1-217-206-7543.E-mail address: Gunasekaran.angappa@uis.edu(A. Gunasekaran).in many industries, especially those in manufacturing,are trying to better manage <strong>supply</strong> <strong>chain</strong>s.Important techniques/methodologies like just-intime(JIT), total quality management, lean production,computer generated enterprise resourceplanning schedule (ERP) and Kaizen have beenembraced. The concept of <strong>supply</strong> <strong>chain</strong> management(SCM), according to Thomas and Griffin(1996) represents the most advanced state in theevolutionary development of purchasing, procurementand other <strong>supply</strong> <strong>chain</strong> activities. At theoperational level, this brings together functionsthat are as old as commerce itself—seeking goods,buying them, storing them and distributing them.At the strategic level, SCM is a relatively new andrapidly expanding discipline that is trans<strong>for</strong>ming0925-5273/$ - see front matter r 2003 Elsevier B.V. All rights reserved.doi:10.1016/j.ijpe.2003.08.003
ARTICLE IN PRESS334A. Gunasekaran et al. / Int. J. Production Economics 87 (2004) 333–347the way that manufacturing and non-manufacturingoperations meet the needs of their customers.Development of cross-functional teams alignsorganisations with process oriented structure,which is much needed to realise a smooth flow ofresources in a <strong>supply</strong> <strong>chain</strong>. As suggested by Trentand Monczka (1994), such teams promote improved<strong>supply</strong> <strong>chain</strong> effectiveness. They minimiseor eliminate functional and departmental boundariesand overcome the drawbacks of specialisation,which according to Fawcett (1995), candistribute the knowledge of all value addingactivities such that no one, including upper levelmanagers, has complete control over the process.Such teams helped in the <strong>for</strong>mation of modern<strong>supply</strong> <strong>chain</strong>s by promoting greater integrationof organisations with their suppliers andcustomers.Supplier partnerships and strategic alliancesrefer to the co-operative and more exclusiverelationships between organisations and their upstreamsuppliers and downstream customers. Todaymany firms have taken bold steps to breakdown both inter and intra firm barriers to <strong>for</strong>malliances, with the objective of reducing uncertaintyand enhancing controlof <strong>supply</strong> anddistribution channels. Such alliances are usuallycreated to increase the financialand operationalper<strong>for</strong>mance of each channelmember throughreductions in totalcost and inventories andincreased sharing of in<strong>for</strong>mation (Maloni andBenton, 1997). Rather than concerning themselvesonly with price, manufacturers are looking tosuppliers to work co-operatively in providingimproved service, technological innovation andproduct design. This development has produced asignificant impact by expanding the scope of SCMthrough greater integration of suppliers withorganisations.The growth and development of SCM is notdriven only by internal motives, but by a numberof externalfactors such as increasing globalisation,reduced barriers to internationaltrade, improvementsin in<strong>for</strong>mation availability, and environmentalconcerns.Furthermore, computer generatedproduction schedules, increasing importanceof controlling inventory, government regulationsand actions such as the creation of a singleEuropean market, and the guidelines of GATTand WTO have provided the stimulus <strong>for</strong> developmentof and existing trends in SCM. Supply<strong>chain</strong> integration is needed to manage and controlthe flow in operating systems. Such flow controlisassociated with inventory controland activitysystem scheduling across the whole range ofresource and time constraints. Supplementing thisflow control, an operating system must try to meetthe broad competitive and strategic objectives ofquality, speed, dependability, flexibility and cost(Slack et al., 1995; Gunasekaran et al., 2001; DeToni and Tonchia, 2001). Controlis also essentialas both customer needs and <strong>supply</strong> <strong>chain</strong> per<strong>for</strong>mancemight change with time.To meet objectives, the output of the processesenabled by the <strong>supply</strong> <strong>chain</strong> must be measured andcompared with a set of standards. In order to becontrolled, the process parameter values need to bekept within a set limit and remain relativelyconstant. This will allow comparison of plannedand actualparameter values, and once done, theparameter values can be influenced throughcertain reactive measures in order to improve theper<strong>for</strong>mance or re-align the monitored value tothe defined value. For example, an analysis of thelayout of facilities could reveal the cause of longdistribution time, high transportation and movementcosts and inventory accumulation. Usingsuitable approaches like re-engineering facilities,problems can be tackled and close monitoring andsubsequent improvements can be possible fromanalysis of the new design. Thus, control ofprocesses in a <strong>supply</strong> <strong>chain</strong> is crucial in improvingper<strong>for</strong>mance and can be achieved, at least in part,through <strong>measurement</strong>. Well-defined and controlledprocesses are essential to better SCM.There are number of conceptual<strong>framework</strong>sand discussions on <strong>supply</strong> <strong>chain</strong> per<strong>for</strong>mance<strong>measurement</strong>s in the literature; however, there isa lack of empirical analysis and case studies onper<strong>for</strong>mance metrics and <strong>measurement</strong>s in a<strong>supply</strong> <strong>chain</strong> environment. We will discuss thebackground <strong>for</strong> the research, review the selectedliterature on <strong>supply</strong> <strong>chain</strong> per<strong>for</strong>mance metricsand <strong>measurement</strong>s, develop a <strong>framework</strong> based onthe literature and an empirical analysis, andfinally, summarize the findings and conclusions.
ARTICLE IN PRESSA. Gunasekaran et al. / Int. J. Production Economics 87 (2004) 333–347 3352. Background <strong>for</strong> researchIn this section, the literature is used in describingthe generalcontext within which <strong>measurement</strong>of <strong>supply</strong> <strong>chain</strong> per<strong>for</strong>mance is undertaken. Theworks of various authors are used in establishingthe need <strong>for</strong> <strong>supply</strong> <strong>chain</strong> per<strong>for</strong>mance <strong>measurement</strong>and to describe in generalterms how it should beaddressed—emphasis is on <strong>measurement</strong> systemsand approaches as opposed to specific measures.The strategic, operational and tactical levels arethe hierarchies in function, wherein policies andtrade-offs can be distinguished and suitable controlexerted(Ballou, 1992). According to Rushtonand Oxley (1989), such a hierarchy is based on thetime horizon <strong>for</strong> activities and the pertinence ofdecisions to and influence of different levels ofmanagement. The strategic level measures influencethe top level management decisions, veryoften reflecting investigation of broad basedpolicies, corporate financial plans, competitivenessand level of adherence to organisational goals. Thetactical level deals with resource allocation andmeasuring per<strong>for</strong>mance against targets to be metin order to achieve results specified at the strategiclevel. Measurement of per<strong>for</strong>mance at this levelprovides valuable feedback on mid-level managementdecisions. Operational level <strong>measurement</strong>sand metrics require accurate data and assess theresults of decisions of low level managers. Supervisorsand workers are to set operationalobjectivesthat, if met, will lead to the achievement oftacticalobjectives.Many firms look to continuous improvement asa toolto enhance their core competitiveness usingSCM. Many companies have not succeeded inmaximizing their <strong>supply</strong> <strong>chain</strong>’s potential becausethey have often failed to develop the per<strong>for</strong>mancemeasures and metrics needed to fully integratetheir <strong>supply</strong> <strong>chain</strong> to maximize effectiveness andefficiency. Lee and Billington (1992) observed thatthe discrete sites in a <strong>supply</strong> <strong>chain</strong> do not maximizeefficiency if each pursues goals independently.They point to incomplete per<strong>for</strong>mance measuresexisting among industries <strong>for</strong> assessment of theentire <strong>supply</strong> <strong>chain</strong>. Measurements should beunderstandable by all <strong>supply</strong> <strong>chain</strong> members andshould offer minimum opportunity <strong>for</strong> manipulation(Schroeder et al., 1986). Per<strong>for</strong>mance studiesand models should be created so that organisationalgoals and achievement of those goals can bemeasured, thus allowing the effectiveness of thestrategy or techniques employed to be accessed.Most companies realise the importance offinancialand non-financialper<strong>for</strong>mance measures,however they have failed to represent them in abalanced <strong>framework</strong>. According to Kaplan andNorton (1992), while some companies and researchershave concentrated on financialper<strong>for</strong>mancemeasures, others have concentrated onoperationalmeasures. Such an inequality doesnot lead to metrics that can present a clear pictureof organisationalper<strong>for</strong>mance. For a balancedapproach, Maskell (1991) suggests that companiesshould understand that, while financial per<strong>for</strong>mance<strong>measurement</strong>s are important <strong>for</strong> strategicdecisions and externalreporting, day to daycontrolof manufacturing and distribution operationsis often handled better with non-financialmeasures. Another area where inequality persists isdeciding upon the number of metrics to be used.Quite often companies have a large number ofper<strong>for</strong>mance measures to which they continue toadd based on suggestions from employees andconsultants. They fail to realise that per<strong>for</strong>manceassessment can be better addressed using a trivialfew—they are not really trivial, but instead arethose few areas most criticalto success.The metrics that are used in per<strong>for</strong>mance<strong>measurement</strong> and improvement should be thosethat truly capture the essence of organizationalper<strong>for</strong>mance. A <strong>measurement</strong> system should facilitatethe assignment of metrics to where theywould be most appropriate. For effective per<strong>for</strong>mance<strong>measurement</strong> and improvement, <strong>measurement</strong>goals must represent organisational goalsand metrics selected should reflect a balancebetween financialand non-financialmeasures thatcan be related to strategic, tactical and operationallevels of decision making and control.3. Per<strong>for</strong>mance <strong>measurement</strong>s and metrics in SCMIn this section, the literature on per<strong>for</strong>mance<strong>measurement</strong>s and metrics in SCM is reviewed.
ARTICLE IN PRESS336A. Gunasekaran et al. / Int. J. Production Economics 87 (2004) 333–347The metrics and measures are discussed in thecontext of the following <strong>supply</strong> <strong>chain</strong> activities/processes: (1) plan, (2) source, (3) make/assemble,and (4) delivery/customer (Stewart, 1995;Gunasekaran et al., 2001).3.1. Metrics <strong>for</strong> order planning3.1.1. The order entry methodThis method determines the way and extent towhich customer specifications are converted intoin<strong>for</strong>mation exchanged along the <strong>supply</strong> <strong>chain</strong>.3.1.2. Order lead-timeThe total order cycle time, called order todelivery cycle time, refers to the time elapsed inbetween the receipt of customer order untilthedelivery of finished goods to the customer. Thereduction in order cycle time leads to reduction in<strong>supply</strong> <strong>chain</strong> response time, and as such is animportant per<strong>for</strong>mance measure and source ofcompetitive advantage (Christopher, 1992)—itdirectly interacts with customer service in determiningcompetitiveness.3.1.3. The customer order pathThe path that an order traverses is anotherimportant measure whereby the time spent indifferent channels can be determined. By analyzingthe customer order path, non-value adding activitiescan be identified so that suitable steps can betaken to eliminate them.3.2. Evaluation of <strong>supply</strong> linkTraditionally supplier per<strong>for</strong>mance measureswere based on price variation, rejects on receiptand on time delivery. For many years, the selectionof suppliers and product choice were mainly basedon price competition with less attention af<strong>for</strong>dedto other criteria like quality, reliability, etc. Morerecently, the whole approach to evaluating suppliershas undergone drastic change.Evaluation of suppliers: The evaluation ofsuppliers in the context of the <strong>supply</strong> <strong>chain</strong>(efficiency, flow, integration, responsiveness andcustomer satisfaction) involves measures importantat the strategic, operationaland tacticallevel.Strategic level measures include lead timeagainst industry norm, Quality level, Costsaving initiatives, and supplier pricing againstmarket.Tactical level measures include the efficiency ofpurchase order cycle time, booking in procedures,cash flow, quality assurance methodology andcapacity flexibility.Operational level measures include ability in dayto day technicalrepresentation, adherence todeveloped schedule, ability to avoid complaintsand achievement of defect free deliveries.Purchasing and <strong>supply</strong> management must analyzeon a periodic basis their supplier abilities tomeet the firm’s long-term needs. The areas thatneed particular attention include the supplier’sgeneral growth plans, future design capability inrelevant areas, role of purchasing and <strong>supply</strong>management in the supplier’s strategic planning,potential<strong>for</strong> future production capacity andfinancialability to support such growth (Fisher,1997). Supply <strong>chain</strong> partnership is a collaborativerelationship between a buyer and seller whichrecognises some degree of interdependence and cooperationon a specific project or <strong>for</strong> a specificpurchase agreement (Ellram, 1991; van Hoek,2001). Such a partnership emphasises direct,long-term association, encouraging mutual planningand problem solving ef<strong>for</strong>ts (Maloni andBenton, 1997). Supplier partnerships have attractedthe attention of practitioners and researchers(Macbeth and Ferguson, 1994; Ellram, 1991;Graham et al., 1994). All have contended thatpartnership <strong>for</strong>mation is vitalin <strong>supply</strong> <strong>chain</strong>operations and as such <strong>for</strong> efficient and effectivesourcing. Partnership maintenance is no lessimportant. Per<strong>for</strong>mance evaluation of buyers orsuppliers is simply not enough—relationships mustbe evaluated.The parameters that need to be considered in theevaluation of partnerships are the ones thatpromote and strengthen them. For example, thelevel of assistance in mutual problem solving isindicative of the strength of supplier partnerships.Partnership evaluation based on such criteria willresult in win–win partnerships leading to moreefficient and more thoroughly integrated <strong>supply</strong><strong>chain</strong>s.
ARTICLE IN PRESSA. Gunasekaran et al. / Int. J. Production Economics 87 (2004) 333–347 3373.3. Measures and metrics at production levelAfter the order is planned and goods sourced,the next step in to make/assemble products. This isthe activity carried out by organisations that ownproduction sites, and their per<strong>for</strong>mance has amajor impact on product cost, quality, speed ofdelivery and delivery reliability, and flexibility(Mapes et al., 1997; Slack et al., 1995). As it isquite an important part of the <strong>supply</strong> <strong>chain</strong>,production needs to be measured and continuouslyimproved. Suitable metrics <strong>for</strong> the productionlevel are as follows:Range of product and services: According to Mapeset al. (1997), a plant that manufactures a broadproduct range is likely to introduce new productsmore slowly than plants with a narrow productrange. Plants that can manufacture a wide range ofproducts are likely to per<strong>for</strong>m less well in the areasof value added per employee, speed and deliveryreliability. This clearly suggests that product rangeaffects <strong>supply</strong> <strong>chain</strong> per<strong>for</strong>mance.Capacity utilization: From the above assertion, it isclear that the role-played by capacity in determiningthe level of activities in a <strong>supply</strong> <strong>chain</strong> is quiteimportant. According to Slack et al. (1995), of themany aspects of production per<strong>for</strong>mance, capacityutilization directly affects the speed of response tocustomer demand through its impact on flexibility,leadtime and deliverability.Effectiveness of scheduling techniques: Schedulingrefers to the time or date on or by which activitiesare to be undertaken. Such fixing determines themanner in which resources will flow in anoperating system, the effectiveness of which hasan important impact on production and thus<strong>supply</strong> <strong>chain</strong> per<strong>for</strong>mance. For example, schedulingtechniques such as JIT, MRP and ERP haveimplications on purchasing, throughput time andbatch size. In case of the <strong>supply</strong> <strong>chain</strong>, sincescheduling depends heavily on customer demandsand supplier per<strong>for</strong>mance, the scheduling toolsshould be viewed in that context (Little et al.,1995).3.4. Evaluation of delivery linkThe link in a <strong>supply</strong> <strong>chain</strong> that directly impactscustomers is delivery. It is a primary determinantof customer satisfaction; hence, measuringand improving delivery is always desirable toincrease competitiveness. Delivery by its verynature takes place in a dynamic and ever-changingenvironment, making the study and subsequentimprovement of a distribution system difficult. Itshould be noted that it is not an easy matter toanticipate how changes to one of the majorelements within a distribution structure willaffect the system as a whole (Rushton and Oxley,1989).3.4.1. Measures <strong>for</strong> delivery per<strong>for</strong>manceevaluationAccording to Stewart (1995), an increase indelivery per<strong>for</strong>mance is possible through a reductionin leadtime attributes. Another importantaspect of delivery per<strong>for</strong>mance is on-time delivery.On-time delivery reflects whether perfect deliveryhas taken place or otherwise and is also a measureof customer service level. A similar concept, ontime order fill, was used by Christopher (1992),describing it as a combination of delivery reliabilityand order completeness. Another aspect ofdelivery is the percentage of finished goods intransit, which if high signifies low inventoryturns, leading to unnecessary increases in tied upcapital. Various factors that can influence deliveryspeed include vehicle speed, driver reliability,frequency of delivery, and location ofdepots. An increase in efficiency in these areas canlead to a decrease in the inventory levels (Novich,1990).Number of faultless notes invoiced: An invoiceshows the delivery date, time and conditionunder which goods were received. By comparingthese with the previously made agreement, itcan be determined whether perfect delivery hastaken place or not, and areas of discrepancycan be identified so that improvements can bemade.Flexibility of delivery systems to meet particularcustomer needs: This refers to flexibility in meetinga particular customer delivery requirement at an
ARTICLE IN PRESS338A. Gunasekaran et al. / Int. J. Production Economics 87 (2004) 333–347agreed place, agreed mode of delivery and withagreed upon customised packaging. This type offlexibility can influence the decision of customersto place orders, and thus can be regarded asimportant in enchanting and retaining customers(Novich, 1990).3.4.2. Total distribution costPerhaps the most important research concerninglogistics is going on in the area of design ofefficient and cost effective distribution systems.For this, an understanding of totaldistributioncost is essential, so that proper trade-offs can beapplied as a basis <strong>for</strong> planning and reassessment ofdistribution systems. The urgency of dealing withtransportation cost was highlighted by Thomasand Griffin (1996), who argued that since transportationcost accounts <strong>for</strong> more than half of thetotallogistics cost, more active research is neededin the area. To dealwith distribution costs,measuring individualcost elements together withtheir impact on customer service encourages tradeoffsthat lead to a more effective and efficientdistribution system.3.5. Measuring customer service and satisfactionTo a world class organisation, a happy andsatisfied customer is of the utmost importance. Ina modern <strong>supply</strong> <strong>chain</strong> customers can reside nextdoor or across the globe, and in either case theymust be well served. Without a contented customer,the <strong>supply</strong> <strong>chain</strong> strategy cannot be deemedeffective. Lee and Billington (1992) and van Hoeket al. (2001) emphasised that to assess <strong>supply</strong> <strong>chain</strong>per<strong>for</strong>mance, <strong>supply</strong> <strong>chain</strong> metrics must centre oncustomer satisfaction.3.5.1. FlexibilityOf the factors by which <strong>supply</strong> <strong>chain</strong>s compete,flexibility can be rightly regarded as a critical one.Being flexible means having the capability toprovide products/services that meet the individualdemands of customers. Some flexibility measuresinclude: (i) product development cycle time, (ii)machine/toolset up time, (iii) economies of scope(Christopher, 1992)—refers to the production ofsmall quantities of wider range (e.g. JIT lot size)—and (iv) number of Inventory turns.3.5.2. Customer query timeCustomer query time relates to the time ittakes <strong>for</strong> a firm to respond to a customer querywith the required in<strong>for</strong>mation. It is not unusual<strong>for</strong> a customer to enquire about the statusof order, potential problems on stock availability,or delivery. A fast and accurate responseto those requests is essentialin keeping customerssatisfied.3.5.3. Post transaction measures of customerserviceThe function of a <strong>supply</strong> <strong>chain</strong> does not endwhen goods are provided to the customer. Posttransaction activities play an important role incustomer service and provide valuable feedbackthat can be used to further improve <strong>supply</strong> <strong>chain</strong>per<strong>for</strong>mance.3.6. Supply <strong>chain</strong> and logistics costThe efficiency of a <strong>supply</strong> <strong>chain</strong> can beassessed using the totallogistics cost—a financialmeasure. It is necessary to assess the financialimpact of broad level strategies and practicesthat contribute to the flow of products in a<strong>supply</strong> <strong>chain</strong>. Since logistics cut across functionalboundaries,care must be taken to assessthe impact of actions to influence costs in onearea in terms of their impact on costs associatedwith other areas (Cavinato, 1992). Forexample, a change in capacity has a major effecton cost associated with inventory and orderprocessing.3.6.1. Cost associated with assets and return oninvestmentSupply <strong>chain</strong> assets include accounts receivable,plant, property and equipment, and inventories.With increasing inflation and decreased liquidity,pressure is on firms to improve the productivity ofcapital—to make the assets sweat. In this regard itis essentialto determine how the cost associatedwith each asset, combined with its turnover, affectstotalcash flow time. One way to address this is by
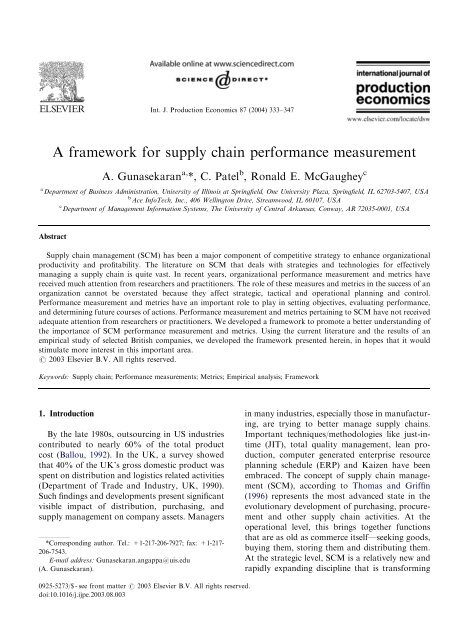
ARTICLE IN PRESSA. Gunasekaran et al. / Int. J. Production Economics 87 (2004) 333–347 339expressing it as an average days required toturn cash invested in assets employed intocash collected from a customer (Stewart, 1995).Thus, totalcash flow time can be regardedas a metric to determine the productivity ofassets in a <strong>supply</strong> <strong>chain</strong>. Once the total cashflow time is determined, this can be readilycombined with profit to provide insight intothe rate of return on investment (ROI). Thisdetermines the per<strong>for</strong>mance by top managementis terms of earnings on the totalcapitalinvestedin a business.With customer service requirements constantlyincreasing, effective management of inventory inthe <strong>supply</strong> <strong>chain</strong> is crucial (Slack et al., 1995). In a<strong>supply</strong> <strong>chain</strong>, the total cost associated withinventory can be broken down into the following(Stewart, 1995; Christopher, 1992; Slack et al.,1995; Lee and Billington, 1992; Levy, 1997):Opportunity cost, consisting of warehousing,capitaland storage; Cost associated with inventoryat the incoming stock level and work in progress;Service costs, consisting of cost associated withstock management and insurance; Cost of finishedgoods including those in transit; Risk costs,consisting of cost associated with pilferage,deterioration, and damage; Cost associated withscrap and rework; and Cost associated with toolittle inventory accounting <strong>for</strong> lost sales/lostproduction.3.6.2. In<strong>for</strong>mation processing costThis includes costs such as those associated withorder entry, order follow/updating, discounts, andinvoicing. On the basis of survey results fromvarious industries, Stewart (1995) identified in<strong>for</strong>mationprocessing cost as the largest contributorto total logistics cost. The role of in<strong>for</strong>mationtechnology is shifting from a general passivemanagement enabler through databases, to ahighly advanced process controller that canmonitor activities and decide upon an appropriateroute <strong>for</strong> in<strong>for</strong>mation. Modern in<strong>for</strong>mation technology,through its power to provide timely,accurate, and reliable in<strong>for</strong>mation, has led to agreater integration of modern <strong>supply</strong> <strong>chain</strong>s thanpossible by any other means (Naim, 1997;Benjamin and Wigand, 1995).4. The research methodologyThe <strong>framework</strong> presented by Gunasekaran et al.(2001) was used in developing a survey used tostudy per<strong>for</strong>mance measures and metrics used in a<strong>supply</strong> <strong>chain</strong> environment. A seven-page questionnaire1 was developed <strong>for</strong> collecting data. Thequestionnaire was divided into four basic sections.They are as follows: plan (including strategy),source/<strong>supply</strong> (order), produce (make/assemble),and delivery (to customer). These four categoriescorrespond to the four basic activities or processesin a <strong>supply</strong> <strong>chain</strong>—plan–source–make/assemble–delivery. The questionnaires were mailed with acover letter and addressed to the CEO of eachfirm. Targeted recipients were instructed to completethe survey themselves or refer it to anappropriate person <strong>for</strong> the same. Participants wereidentified using the ‘Kompass Register’ <strong>for</strong> UKindustries (Volumes I and II) published by theReed Business In<strong>for</strong>mation Ltd., West Sussex,UK. A total of 150 large companies were selectedfrom a wide range of industry settings.5. Empirical analysisOf the 150 questionnaires mailed, 21 werecompleted and returned. A breakdown of thesurvey response is shown in Fig. 1. Nearly all theresponses were received within 4 weeks of mailing.Twelve companies said that because of the largernumber of such enquiries they were unable toreply. Ten companies returned the questionnairestating that they were not suitable candidates <strong>for</strong>the survey because of changes in their operations.The response rate was only 14%, but we felt that itwas adequate to assist us in developing our<strong>framework</strong>.5.1. Planning per<strong>for</strong>mance evaluation metricsThis section deals with financial and nonfinancialstrategiclevelper<strong>for</strong>mance measures.The importance of these parameters was establishedby calculating the mean of all responses and1 Available upon request from authors
ARTICLE IN PRESS340A. Gunasekaran et al. / Int. J. Production Economics 87 (2004) 333–347Responded withcompleted questionnaire14%Said were notable to replyTable 1Ratings strategic planning metrics8%AssessmentStrategic per<strong>for</strong>mancemetricsPercentageimportance71%Did not respond tothe questionnaireFig. 1. Breakdown of response <strong>for</strong> the survey.7%Returned thequestionnairewithoutcompleting itranking them accordingly. The ranks were convertedto relative percentages by dividing eachrank, by the totalof a lranks <strong>for</strong> the group ofmeasures/metrics. This approach is similar to themethod used in Pareto analysis wherein problemfrequencies are converted to percentages to showrelative importance. The percentages better highlightdifferences in the importance of per<strong>for</strong>mancemeasures in each group (we used this approach inanalysing per<strong>for</strong>mance measures in all groupsdiscussed herein). We further categorized themeasures based on importance (highly important,moderately important and less important). Themethodology employed <strong>for</strong> such was similar to themethodology used in ABC inventory (inventoryitem’s annualcost is stated as a percent of totalinventory costs) to prioritize inventory managementdecisions (item cost percentages sorted indescending order and grouped into A—mostimportant, B—moderate importance, and C—lessimportant based on their contribution to totalcosts). We used this approach in analysingper<strong>for</strong>mance measures in all groups discussedherein. Please note that categorizing a measure asless important does not mean it is unimportant,but rather it seems less important compared toothers in the <strong>measurement</strong> group. We believe asimilar approach could be used by managers insetting priorities in the development of a <strong>measurement</strong>system <strong>for</strong> <strong>supply</strong> <strong>chain</strong> per<strong>for</strong>mance. Oursmall sample size precluded the use of morepowerfulstatisticaltechniques. We believe ourapproach is adequate <strong>for</strong> our use of the data in<strong>framework</strong> development. A more rigorous studyHighly importantModeratelyimportantLess importantLevel of customerperceived value ofproduct16.42Variances against 14.23budgetOrder lead time 13.50In<strong>for</strong>mation processing 12.68costNet profit Vs12.46productivity ratioTotalcycle time 11.80Totalcash flow time 10.27Levelof energyutilisation8.64to validate the <strong>framework</strong> should employ a bettersample and more rigorous statistical techniques.The first set of measures (five non-financialandthree financial) pertain to planning, but morespecifically to strategic planning. Table 1 showsthe measures and their relative importance asdetermined by our analysis of the survey data.The importance rating survey results show thatthe level of customer perceived value of product isof the utmost importance. It was deemed highlyimportant which clearly reflects the perception ofpractitioners that customer satisfaction is paramountin importance in increasing competitiveness.The measures considered moderatelyimportant in descending order include variancesagainst budget, order lead-time, in<strong>for</strong>mationprocessingcost, net profit vs. productivity ratio,totalcycle time and totalcash flow time. Variancesagainst budget, in<strong>for</strong>mation-processing cost andnet profit vs. productivity are of course financialmeasures and reflect the importance of financialmeasures in strategic planning and control—financialstability is essentialto organizationalsuccess. The other three moderately importantmeasures were order lead time, total cycle time andtotalcash flow time. Their rating further highlightsthe importance of non-financialmeasures instrategic planning and control and to subsequent
ARTICLE IN PRESSA. Gunasekaran et al. / Int. J. Production Economics 87 (2004) 333–347 341Table 2Importance of order planning metricsAssessment Metrics PercentageimportanceHighly important Customer query time 19.11ModeratelyimportantProduct developmentcycle time17.37Less important Accuracy of <strong>for</strong>ecasting 16.59Planning process cycle 15.90timeOrder entry methods 15.51Human resourceproductivity15.51organizational success. The only strategic planningmeasure deemed less important was level of energyutilisation which may suggest that it is not ofstrategic significance. That, of course, could varyfrom firm to firm, depending on energy cost as apercent of totalmanufacturing cost and on energyprice levels relative to the prices of other manufacturinginputs.The percentage importance (relative importance)of the strategic per<strong>for</strong>mance metrics clearlysuggests that non-financialmeasures of per<strong>for</strong>manceare considered by practitioners to beimportant in assessing the competitiveness of anorganization. This is not to say that financialmeasures are no longer important, but rather thatnon-financialmeasures are important and necessaryin assessing a firm’s ability to compete.In Table 2, the order of priority <strong>for</strong> the orderplanning level metrics is presented. At the orderplanning level, customer query time was highlyimportant, which would seem to emphasize theimportance of customer service. Product developmentcycle time and <strong>for</strong>ecasting were moderatelyimportant. These two factors relate to meetingcustomer needs and doing so in a timely fashion.Although there is no statistical evidence containedherein to prove such a link, common sensesuggests a link between these and the perceivedcustomer value of the product, rated number oneamong the strategy per<strong>for</strong>mance measures. Theimportance ratings of product development cycletime and <strong>for</strong>ecasting measures suggests that theywarrant monitoring by management and improvementef<strong>for</strong>t. Cross-functionalteams, rapid prototyping,and concurrent engineering involvingsuppliers would seem appropriate in ef<strong>for</strong>ts toimprove product development cycle time. Manyalternative techniques are available <strong>for</strong> <strong>for</strong>ecasting.If <strong>for</strong>ecasting accuracy is a concern, firms mightexamine the techniques employed with an eyetoward improvement. Because the <strong>for</strong>ecasts of all<strong>supply</strong> <strong>chain</strong> links can influence <strong>supply</strong> <strong>chain</strong>per<strong>for</strong>mance, a concerted ef<strong>for</strong>t by all should bemade to assure accurate <strong>for</strong>ecasts. This is emphasizedby a survey participant (a machine toolmanufacturer) who said that <strong>supply</strong> <strong>chain</strong> partnersshould ‘‘Use better <strong>for</strong>ecasting techniques to removeuncertainties in <strong>supply</strong> <strong>chain</strong>.’’ Many understandthe consequences of weak <strong>for</strong>ecastingper<strong>for</strong>mance and recognize the need to measureand improve it.By benchmarking their <strong>for</strong>ecasting methodswith those of the best, a better understanding thetechniques might be gained and greater accuracyachieved. Also, by integrating production scheduleswith others in the <strong>supply</strong> <strong>chain</strong>, moreaccurate day to day demand <strong>for</strong>ecast might bepossible <strong>for</strong> all links in the <strong>supply</strong> <strong>chain</strong>. Planningprocess cycle time, order entry methods, andhuman resource productivity were the less importantorder planning measures. Planning processcycle time and order entry methods could beimproved through reengineering ef<strong>for</strong>ts that includemultiple links in the <strong>supply</strong> <strong>chain</strong>, becausethe actions of multiple participants interact toinfluence per<strong>for</strong>mance in these areas. Improvementsin customer query time, product developmentcycle time and planning process cycle timemight be brought about by greater humanresource productivity, so although it was ratedlast in importance, human resource productivityshould not be dismissed as unimportant. Improvementin order entry methods, customer query time,<strong>for</strong>ecasting accuracy and customer query timemight be brought about through the application ofin<strong>for</strong>mation technology to increase accuracy andexpedite the flow of in<strong>for</strong>mation throughout the<strong>supply</strong> <strong>chain</strong>. Process cycle time can be tackled byusing techniques like single minute exchange of dieand group technology, whereby similar facilities
ARTICLE IN PRESS342A. Gunasekaran et al. / Int. J. Production Economics 87 (2004) 333–347<strong>for</strong> production will be grouped to reduce manufacturinglead-time.5.2. Supply link evaluation metricsDue to the growing importance outsourcing,whereby firms outsource a major part of theirproducts, evaluation of <strong>supply</strong> link per<strong>for</strong>mance isvery important in managing the <strong>supply</strong> <strong>chain</strong> <strong>for</strong>peak efficiency and effectiveness. In this section,the importance of per<strong>for</strong>mance measures/metricsin a <strong>supply</strong> <strong>chain</strong> link (includes purchasing andsupplier management activities) are rated inimportance. Based on the literature, six keyper<strong>for</strong>mance indicators (KPI) pertaining to thesupplier link were included in the survey andranked by participants. These measures include:supplier delivery per<strong>for</strong>mance, lead-time againstindustry norm, supplier pricing against market,efficiency of purchase order cycle time, efficiencyof cashflow method, and <strong>supply</strong> booking procedures.The main objective here is to identify theKPI in <strong>supply</strong> link per<strong>for</strong>mance evaluation. TheKPI can be defined as the per<strong>for</strong>mance indicatorsthat have significant impact on the overallper<strong>for</strong>mance of an organization in the areas ofstrategic, tacticaland operationalplanning andcontrol. The percentage importance ratings of thesix measures are included in Table 3.As can be seen in Table 3, supplier deliveryper<strong>for</strong>mance emerged as the most importantmeasure pertaining to the evaluation of supplierper<strong>for</strong>mance. It was the only highly importantmeasure. One can see from the table that it isclearly set apart from the others by its percentageimportance rating. The moderately importantmeasures in descending order are supplier leadtimeagainst industry norm, supplier pricingagainst market and efficiency of purchase ordercycle time. The less important supplier measureswere efficiency of cash flow method and supplierbooking in procedures. Most notable about thesupplier metrics is that firms regard the supplier’scapability to reliably deliver goods in a timelyfashion as more important than price. Price hasincreasing become an order qualifier rather thanan order winner. Other aspects of supplierper<strong>for</strong>mance such as adherence to agreed uponTable 3Importance of supplier metricsAssessment Metrics PercentageimportanceHighly importantModeratelyimportantLess importantSupplier deliveryper<strong>for</strong>manceSupplier lead-timeagainst industry normSupplier pricing againstmarketEfficiency of purchaseorder cycle timeEfficiency of cash-flowmethodSupplier booking inprocedures23.2019.6918.3015.4212.3811.01schedules and terms of the order as well as promptdelivery of goods have become order winners.Firms would do well to not just use suppliermetrics <strong>for</strong> selection of suppliers, but rather theyshould work closely with suppliers to see that theyhave in place within their organizations, <strong>measurement</strong>systems that will foster significant improvementin all of these areas. Such improvementcontributes to the overall success of a <strong>supply</strong><strong>chain</strong>.5.3. Production per<strong>for</strong>mance evaluation metricsIn this section, <strong>supply</strong> <strong>chain</strong> production linkmetrics/measures are rated in importance. Theliterature provided the production link measures,and as with other metrics evaluated in this paper,the survey responses provided the basis <strong>for</strong> ratingthe importance of these measures. The per<strong>for</strong>mancemeasures <strong>for</strong> the production link includedpercentage of defects (a measure of productquality), cost per operation-hour, capacity utilization,range of product and services, and utilizationof economic order quantity. Table 4 contains themeasures and their percentage importance ratings.From the table one can see that the percentage ofdefects emerged to be the most important(24.27%), but two others, cost per operation hourand capacity utilization, were also highly important.The latter two are essentially measures of the
ARTICLE IN PRESSA. Gunasekaran et al. / Int. J. Production Economics 87 (2004) 333–347 343Table 4Importance of production metricsAssessment Metrics PercentageimportanceHighly important Percentage of defects 24.27Cost per operation hour 22.51Capacity utilization 21.61ModeratelyimportantLess importantRange of products andservicesUtilization of economicorder quantity18.0113.60efficiency with which resources are used inmanufacturing (produce/assemble), and good per<strong>for</strong>mancein these two areas translates into lowercost per unit to manufacture products/provideservices. Efficiency of operations is important <strong>for</strong>all <strong>supply</strong> <strong>chain</strong> partners, if the elusive goal of<strong>supply</strong> <strong>chain</strong> optimization is to be achieved. Notethat the percentage importance of each of thesethree clearly sets them apart from the moderatelyimportant and less important measures. We shouldcaution that maximum efficiency of each partnerin all areas might not be a desirable becausetradeoffs are necessary in order to achieve a globaloptimum <strong>for</strong> the <strong>supply</strong> <strong>chain</strong>—local optimums inall parts do not necessarily lead to globaloptimization <strong>for</strong> a system.The only measure rated moderately importantwas range of products and services. As noted in theliterature, a broader range of products tends toresult in fewer new products being introduced anda more narrow range is associated with greaterproduct innovation. For this reason, the measuredoes seem worthy of the attention of managers,especially in making decisions about the breadthand depth of product lines. The least importantmeasure in the production link measures wasutilization of economic order quantity. It was theonly measure rated less important. It may be thatthe participants, in assigning their ratings, regardedthe use of EOQ as a means to an end ratherthan an end in and of itself. In short, quality andefficiency seem to be more important considerationsin evaluating production per<strong>for</strong>mance.5.4. Delivery per<strong>for</strong>mance evaluation metricsAfter the orders are planned and goods sourced,produced and assembled, the remaining task is todeliver them to customer. Table 5 shows the orderof importance of delivery per<strong>for</strong>mance measures.Quality of delivered goods is first in importance,followed by on time delivery of goods andflexibility of service systems to meet customerneeds. These three measures are highly important.Note that there is very little difference in the ratingof quality of delivered goods and on time deliver ofgoods. Here again, we believe that these three arerelated to the perceived customer value of theproduct, the top ranking strategic planning measure.Providing the customer with a qualityproduct in a timely fashion, and maintainingcustomer satisfaction with a service system designedto flexibly respond to customer needs arekey in producing value <strong>for</strong> the customer.The effectiveness of the enterprise distributionTable 5Importance of delivery per<strong>for</strong>mance measuresAssessmentHighly importantModeratelyimportantLess importantDelivery per<strong>for</strong>mancemetricsQuality of deliveredgoodsOn time delivery ofgoodsFlexibility of servicesystems to meetcustomer needsEffectiveness ofenterprise distributionplanning scheduleEffectiveness of deliveryinvoice methodsNumber of faultlessdelivery notes invoicedPercentage of urgentdeliveriesIn<strong>for</strong>mation richness incarrying out deliveryPercentage of finishedgoods in transitDelivery reliabilityper<strong>for</strong>mancePercentagerating12.3412.2011.4310.3110.2310.059.328.767.767.70
ARTICLE IN PRESS344A. Gunasekaran et al. / Int. J. Production Economics 87 (2004) 333–347planning schedule, effectiveness of delivery invoicemethods, number of faultless delivery notesinvoiced, percentage of urgent deliveries andin<strong>for</strong>mation richness in carrying out the deliveryare moderately important. According to the ratingof measures, while unquestionably important,these measures are not as important as the qualityof the delivered product and on time delivery. Itwould seem, at least on the surface that on timedelivery would result from an effective enterprisedistribution planning schedule, so itwould probably be unwise to ignore the obviousimportance of the enterprise distribution planningschedule—one is the means and the otherthe end.In the survey, companies were asked to expresstheir views on reducing the cost of a deliverysystem. Their responses tended to emphasizetechniques like JIT and the application of automationalternatives to reduce costs. Trade-offsbetween centralisation of the distribution systemand decentralisation of the system were mentionedas was third party logistics.6. A <strong>framework</strong> <strong>for</strong> per<strong>for</strong>mance <strong>measurement</strong> ina <strong>supply</strong><strong>chain</strong>In this section, a <strong>framework</strong> <strong>for</strong> per<strong>for</strong>mancemeasures and metrics is presented (see Table 6),considering the four major <strong>supply</strong> <strong>chain</strong> activities/processes (plan, source, make/assemble, and deliver).These metrics were classified at strategic,tacticaland operationalto clarify the appropriatelevel of management authority and responsibility<strong>for</strong> per<strong>for</strong>mance. This <strong>framework</strong> is based in partof a theoretical<strong>framework</strong> discussed by Gunasekaranet al. (2001) and on the empiricalanalysisreported herein. Measures are grouped in cells atthe intersection of the <strong>supply</strong> <strong>chain</strong> activity andplanning level. For example, Supplier deliveryper<strong>for</strong>mance can be found at the intersection ofthe Source activity and Tactical planning levelindicating that it pertains to sourcing activities(source) and the tactical planning level. Supplierdelivery per<strong>for</strong>mance would thus be a measureuseful in analyzing the per<strong>for</strong>mance of mid-levelmanagers as they undertake sourcing activities—mid-level managers who are generally the onesresponsible <strong>for</strong> tactical decisions.The items in each cell are listed in the order ofimportance based on percentage importance ratings.Those ratings can be seen in Tables 1–5.Readers can refer to those tables in order to moreclosely examine the importance ratings of individualmeasures/metrics.Some measures appear inmore than one cell, indicating that measures maybe appropriate at more than one managementlevel. Measures used at different managementlevels will most assuredly require adjustment totailor them to planning and control needs of thedifferent levels. For example, appropriate <strong>measurement</strong>may require that data used by the lowerlevel of management be aggregated in some <strong>for</strong>mor fashion to make the data appropriate <strong>for</strong> thenext higher level (convert data into in<strong>for</strong>mationappropriate <strong>for</strong> the context). There is nothingnovelabout this approach, as it has been used<strong>for</strong> years in management planning and controlsystems.The approach we used in organizing themeasures <strong>for</strong> the <strong>framework</strong> could be used byorganizations in development of a per<strong>for</strong>mance<strong>measurement</strong> program <strong>for</strong> SCM. Managers and/orconsultants could identify <strong>measurement</strong>s (werecommended many such <strong>measurement</strong>s herein),rate their importance using the methodology weused <strong>for</strong> rating importance, and construct a matrixlike our own to identify the <strong>supply</strong> <strong>chain</strong> activity/process to be measured, the <strong>measurement</strong>, andlevel of management to which the measure shouldbe applied. More detail could be added to fixpersonalresponsibility <strong>for</strong> measures with individualmanagers,or management positions.Readers should keep in mind that this <strong>framework</strong>is based largely on metrics discussed in theliterature. Individual firms will certainly haveper<strong>for</strong>mance <strong>measurement</strong> needs that reflect theunique operations of their business and of coursenot all <strong>supply</strong> <strong>chain</strong>s are identical. Thus othermeasures may be desirable and should be developedby firms and <strong>supply</strong> <strong>chain</strong> participants toreflect their unique needs. This <strong>framework</strong> shouldbe regarded as a starting point <strong>for</strong> an assessmentof the need <strong>for</strong> <strong>supply</strong> <strong>chain</strong> per<strong>for</strong>mance <strong>measurement</strong>.It is likewise important to understand
ARTICLE IN PRESSA. Gunasekaran et al. / Int. J. Production Economics 87 (2004) 333–347 345Table 6Supply <strong>chain</strong> per<strong>for</strong>mance metrics <strong>framework</strong>Supply<strong>chain</strong>activity/processStrategicTacticalOperationalPlanLevel of customer perceived value ofproduct, Variances against budget,Order lead time, In<strong>for</strong>mationprocessing cost, Net profit Vsproductivity ratio, Totalcycle time,Totalcash flow time, Productdevelopment cycle timeCustomer query time, Productdevelopment cycle time, Accuracy of<strong>for</strong>ecasting techniques, Planningprocess cycle time, Order entrymethods, Human resourceproductivityOrder entry methods, Humanresource productivitySourceSupplier delivery per<strong>for</strong>mance,supplier leadtime against industrynorm, supplier pricing againstmarket, Efficiency of purchase ordercycle time, Efficiency of cash flowmethod, Supplier booking inproceduresEfficiency of purchase order cycletime, Supplier pricing againstmarketMake/AssembleRange of products and servicesPercentage of defects, Cost peroperation hour, Capacity utilization,Utilization of economic orderquantityPercentage of Defects, Cost peroperation hour, Human resourceproductivity indexDeliverFlexibility of service system to meetcustomer needs, Effectiveness ofenterprise distribution planningscheduleFlexibility of service system to meetcustomer needs, Effectiveness ofenterprise distribution planningschedule, Effectiveness of deliveryinvoice methods, Percentage offinished goods in transit, Deliveryreliability per<strong>for</strong>manceQuality of delivered goods, On timedelivery of goods, Effectiveness ofdelivery invoice methods, Numberof faultless delivery notes invoiced,Percentage of urgent deliveries,In<strong>for</strong>mation richness in carrying outdelivery, Delivery reliabilityper<strong>for</strong>mancethat the rated importance of metrics in this<strong>framework</strong> is based on a relatively small sample,and thus, care should be taken in generalizingresults to all <strong>supply</strong> <strong>chain</strong>s. The importance ofindividualmetrics presented herein might notapply to all <strong>supply</strong> <strong>chain</strong>s in all industries. Again,the <strong>framework</strong> is only a starting point. It is hopedthat this <strong>framework</strong> will assist practitioners intheir ef<strong>for</strong>ts to assess <strong>supply</strong> <strong>chain</strong> per<strong>for</strong>mance.7. ConclusionsIn our survey participants were asked whethertheir return on investment had increased toexpected levels after implementing contemporary<strong>supply</strong> <strong>chain</strong> management (SCM) practices. The76% affirmative response to that question clearlyshowed that ef<strong>for</strong>t focused on carefully managing<strong>supply</strong> <strong>chain</strong>s produced financial benefits <strong>for</strong>participating firms. From a financialperspectivealone, a proactive approach to SCM is advisable<strong>for</strong> firms wanting to enhance competitiveness.The SCM literature suggests that effective SCMhelp to win customers and improve customerservice. Some 66% of the respondents in oursurvey noted the positive impact of SCM onmarket share, providing more evidence of thestrategic importance of successfulSCM. Thepotentialbenefits of SCM make it attractive, but
ARTICLE IN PRESS346A. Gunasekaran et al. / Int. J. Production Economics 87 (2004) 333–347improved per<strong>for</strong>mance is not automatic. As withany other organisationalundertaking, it must bedone well to yield positive results. This is why webelieve it is important to assess per<strong>for</strong>mance inSCM and the reason we developed the SCMper<strong>for</strong>mance <strong>measurement</strong> <strong>framework</strong>.To bring about improved per<strong>for</strong>mance in a<strong>supply</strong> <strong>chain</strong> and move closer to attainment of theillusive goal of <strong>supply</strong> <strong>chain</strong> optimization, per<strong>for</strong>mance<strong>measurement</strong> and improvement studiesmust be done throughout the <strong>supply</strong> <strong>chain</strong>. Allparticipants in the <strong>supply</strong> <strong>chain</strong> should be involvedand committed to common goals, such as customersatisfaction throughout the <strong>supply</strong> <strong>chain</strong> andenhanced competitiveness. A per<strong>for</strong>mance <strong>measurement</strong>program <strong>for</strong> a <strong>supply</strong> <strong>chain</strong> should becomplete—important aspects of per<strong>for</strong>mance inany link are not ignored—and they must betailored to varying needs of participants. A goodSCM program will bring about improved crossfunctionalandintra-organisationalprocess planningand control and more complete <strong>supply</strong> <strong>chain</strong>integration. A <strong>supply</strong> <strong>chain</strong> wide per<strong>for</strong>mance<strong>measurement</strong> initiative would seem most appropriate.This is not to suggest that one party dictate<strong>measurement</strong> programs <strong>for</strong> all <strong>supply</strong> <strong>chain</strong>participants, but rather that all participants takepart in developing a well planned, well coordinated,<strong>supply</strong> <strong>chain</strong>-wide per<strong>for</strong>mance <strong>measurement</strong>initiative to which all can and will becommitted. A comprehensive controlsystem wi lbe necessary in order to assure effective andefficient per<strong>for</strong>mance <strong>measurement</strong> all along the<strong>supply</strong> <strong>chain</strong>, but it must not be done in such away as to unduly limit the decision makingauthority of managers in participating organizations.Care must be exercised in developing such asystem in order that it promotes mutually advantageousexchange among participants, so thatrelationships endure the test of time.Additionalresearch and practitioner-driven initiativesare needed in the area of SCM per<strong>for</strong>mance<strong>measurement</strong>. Creative ef<strong>for</strong>ts are neededto design new measures and new programs <strong>for</strong>assessing the per<strong>for</strong>mance of the <strong>supply</strong> <strong>chain</strong> as awhole as well as the per<strong>for</strong>mance of eachorganization that is a part of the <strong>supply</strong> <strong>chain</strong>.Organisation, suppliers and customers shouldcome together to discuss how they will addressthe <strong>measurement</strong> and improvement of SCMper<strong>for</strong>mance. Industry consortiums, consultants,and researchers could be helpful in promotingSCM per<strong>for</strong>mance <strong>measurement</strong> generally, and indeveloping measures and <strong>measurement</strong> techniquesspecifically. They could play a significant role inhelping firms address the present and futurechallenges of managing <strong>supply</strong> <strong>chain</strong>s. Clearlytremendous opportunity exists to develop measuresthat facilitate progress and promote greater<strong>supply</strong> <strong>chain</strong> integration.AcknowledgementsThe authors gratefully acknowledge the constructiveand helpful comments of two anonymousreferees on the earlier version of the manuscript.ReferencesBallou, R.H., 1992. Business Logistics Management. Prentice-Hall, Inc., Englewood Cliffs, NJ.Benjamin, R., Wigand, R., 1995. Electronic markets and virtualvalue <strong>chain</strong>s on the in<strong>for</strong>mation superhighway. SloanManagement Review 36 (2), 62–72.Cavinato, J.L., 1992. Total cost value model <strong>for</strong> <strong>supply</strong> <strong>chain</strong>competitiveness. Journalof Business Logistics 13(2), 285–291.Christopher, M., 1992. Logistics and Supply Chain Management.Pitman Publishing, London.De Toni, A., Tonchia, S., 2001. Per<strong>for</strong>mance <strong>measurement</strong>systems: Models, characteristics and measures. InternationalJournalofOperations & Production Management 21(1/2), 46–70.Ellram, L.M., 1991. A managerial guide <strong>for</strong> the developmentand implementation of purchasing partnerships. InternationalJournalofPurchasing and Materials Management 27(3), 2–8.Fawcett, S.E., 1995. Using strategic assessment to increase thevalue-added capabilities of manufacturing and logistics.Production and Inventory Management Journal36 (2),33–37.Fisher, L.M., 1997. What is the right <strong>supply</strong> <strong>chain</strong> <strong>for</strong> yourproduct? Harvard Business Review 75 (2), 105–116.Graham, T.S., Dougherty, P.J., Dudley, W.N., 1994. The longterm strategic impact of purchasing partnerships. InternationalJournalofPurchasing and Materials Management 30(4), 13–18.Gunasekaran, A., Patel, C., Tirtiroglu, E., 2001. Per<strong>for</strong>mancemeasure and metrics in a <strong>supply</strong> <strong>chain</strong> environment.
ARTICLE IN PRESSA. Gunasekaran et al. / Int. J. Production Economics 87 (2004) 333–347 347InternationalJournalof Operations & Production Management21 (1/2), 71–87.Kaplan, R.S., Norton, P.D., 1992. The balanced scoreboardmeasuresthat drives per<strong>for</strong>mance. Harvard BusinessReview 70 (1), 71–79.Lee, H.L., Billington, C., 1992. Managing <strong>supply</strong> <strong>chain</strong>inventory: Pitfalls and opportunities. Sloan ManagementReview 33 (3), 65–73.Levy, D.L., 1997. Lean production in an international<strong>supply</strong><strong>chain</strong>. Sloan Management Review 38 (2), 94–102.Little, D., Kenworthy, J., Jarvis, P., Porter, K., 1995.Scheduling across the <strong>supply</strong> <strong>chain</strong>. Logistics In<strong>for</strong>mationManagement 8 (1), 42–48.MacBeth, D.K., Ferguson, N., 1994. Partnership Sourcing: AnIntegrated Supply Chain Management Approach. PitmanPublishing, London.Maloni, M.J., Benton, W.C., 1997. Supply <strong>chain</strong> partnerships:Opportunities <strong>for</strong> operations research. European JournalofOperationalResearch 101, 419–429.Mapes, J., New, C., Szwejczewski, M., 1997. Per<strong>for</strong>mancetrade-offs in manufacturing plants. InternationalJournalof Operations & Production Management 17 (10),1020–1033.Maskell, B.H., 1991. Per<strong>for</strong>mance Measurement <strong>for</strong> WorldClass Manufacturing. Productivity Press, Inc., Portland,OR.Naim, M.M., 1997. The Book That Changed the World.Manufacturing Engineer (February), 13–16.Novich, N., 1990. Distribution strategy: Are you thinking smallenough? Sloan Management Review 32 (1), 71–77.Rushton, A., Oxley, J., 1989. Handbook of Logistics andDistribution Management. Kogan Page Ltd., London.Schroeder, R.G., John, C.A, Scudder, G.D., 1986. White collarproductivity <strong>measurement</strong>. Management Decision 24 (5),3–7.Slack, N., Chambers, S., Harland, C., Harrison, A., Johnston,R., 1995. Operations Management. Pitman Publishing,London.Stewart, G., 1995. Supply <strong>chain</strong> per<strong>for</strong>mance benchmarkingstudy reveals keys to <strong>supply</strong> <strong>chain</strong> excellence. LogisticsIn<strong>for</strong>mation Management 8 (2), 38–44.Thomas, D.J., Griffin, P.M., 1996. Co-ordinated <strong>supply</strong> <strong>chain</strong>management. European Journalof OperationalResearch 94(3), 1–15.Trent, R.J., Monczka, R.M., 1994. Effective cross-functionalsourcing teams: Criticalsuccess factors. InternationalJournalof Purchasing and Materials Management 30 (4),3–11.van Hoek, R.I., 2001. The contribution of per<strong>for</strong>mance<strong>measurement</strong> to the expansion of third party logisticsalliances in the <strong>supply</strong> <strong>chain</strong>. International Journal ofOperations & Production Management 21 (1/2), 15–29.van Hoek, R.I., Harrison, A., Christopher, M., 2001. Measuringagile capabilities in the <strong>supply</strong> <strong>chain</strong>. InternationalJournalof Operations & Production Management 21 (1/2),126–147.