Female Economic Empowerment in the ERF Region
Female Economic Empowerment in the ERF Region
Female Economic Empowerment in the ERF Region

You also want an ePaper? Increase the reach of your titles
YUMPU automatically turns print PDFs into web optimized ePapers that Google loves.
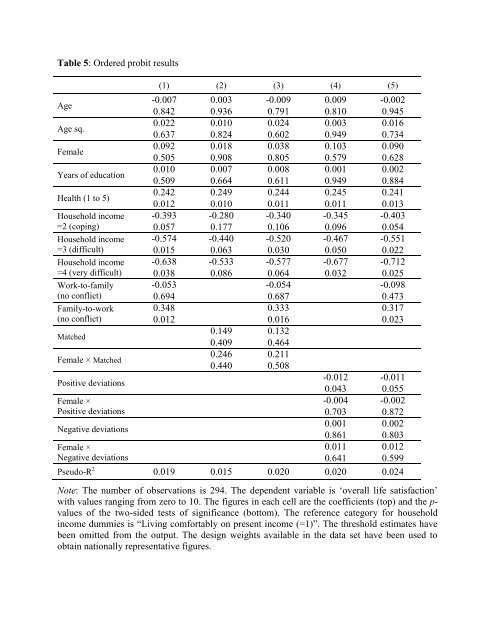
Table 5: Ordered probit results(1) (2) (3) (4) (5)Age-0.007 0.003 -0.009 0.009 -0.0020.842 0.936 0.791 0.810 0.945Age sq.0.022 0.010 0.024 0.003 0.0160.637 0.824 0.602 0.949 0.734<strong>Female</strong>0.092 0.018 0.038 0.103 0.0900.505 0.908 0.805 0.579 0.628Years of education0.010 0.007 0.008 0.001 0.0020.509 0.664 0.611 0.949 0.884Health (1 to 5)0.242 0.249 0.244 0.245 0.2410.012 0.010 0.011 0.011 0.013Household <strong>in</strong>come -0.393 -0.280 -0.340 -0.345 -0.403=2 (cop<strong>in</strong>g)0.057 0.177 0.106 0.096 0.054Household <strong>in</strong>come -0.574 -0.440 -0.520 -0.467 -0.551=3 (difficult)0.015 0.063 0.030 0.050 0.022Household <strong>in</strong>come -0.638 -0.533 -0.577 -0.677 -0.712=4 (very difficult) 0.038 0.086 0.064 0.032 0.025Work-to-family -0.053 -0.054 -0.098(no conflict)0.694 0.687 0.473Family-to-work 0.348 0.333 0.317(no conflict)0.012 0.016 0.023Matched0.149 0.1320.409 0.464<strong>Female</strong> × Matched0.246 0.2110.440 0.508Positive deviations-0.012 -0.0110.043 0.055<strong>Female</strong> ×-0.004 -0.002Positive deviations0.703 0.872Negative deviations0.001 0.0020.861 0.803<strong>Female</strong> ×0.011 0.012Negative deviations0.641 0.599Pseudo-R 2 0.019 0.015 0.020 0.020 0.024Note: The number of observations is 294. The dependent variable is ‘overall life satisfaction’with values rang<strong>in</strong>g from zero to 10. The figures <strong>in</strong> each cell are <strong>the</strong> coefficients (top) and <strong>the</strong> p-values of <strong>the</strong> two-sided tests of significance (bottom). The reference category for household<strong>in</strong>come dummies is “Liv<strong>in</strong>g comfortably on present <strong>in</strong>come (=1)”. The threshold estimates havebeen omitted from <strong>the</strong> output. The design weights available <strong>in</strong> <strong>the</strong> data set have been used toobta<strong>in</strong> nationally representative figures.