Presentation - Investor Relations - Tanker
Presentation - Investor Relations - Tanker
Presentation - Investor Relations - Tanker

Create successful ePaper yourself
Turn your PDF publications into a flip-book with our unique Google optimized e-Paper software.
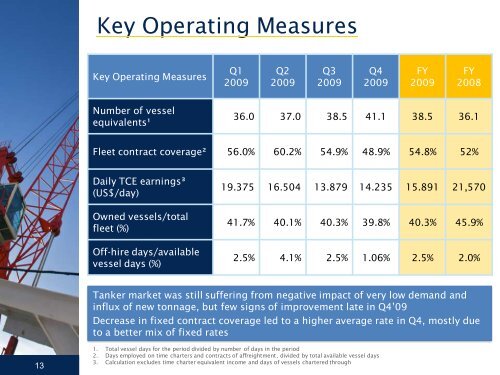
Key Operating MeasuresKey Operating MeasuresQ12009Q22009Q32009Q42009FY2009FY2008Number of vesselequivalents¹36.0 37.0 38.5 41.1 38.5 36.1Fleet contract coverage² 56.0% 60.2% 54.9% 48.9% 54.8% 52%Daily TCE earnings³(US$/day)Owned vessels/totalfleet (%)Off-hire days/availablevessel days (%)19.375 16.504 13.879 14.235 15.891 21,57041.7% 40.1% 40.3% 39.8% 40.3% 45.9%2.5% 4.1% 2.5% 1.06% 2.5% 2.0%<strong>Tanker</strong> market was still suffering from negative impact of very low demand andinflux of new tonnage, but few signs of improvement late in Q4‟09Decrease in fixed contract coverage led to a higher average rate in Q4, mostly dueto a better mix of fixed rates131. Total vessel days for the period divided by number of days in the period2. Days employed on time charters and contracts of affreightment, divided by total available vessel days3. Calculation excludes time charter equivalent income and days of vessels chartered through