TEST REPORT - Ursa
TEST REPORT - Ursa
TEST REPORT - Ursa

You also want an ePaper? Increase the reach of your titles
YUMPU automatically turns print PDFs into web optimized ePapers that Google loves.
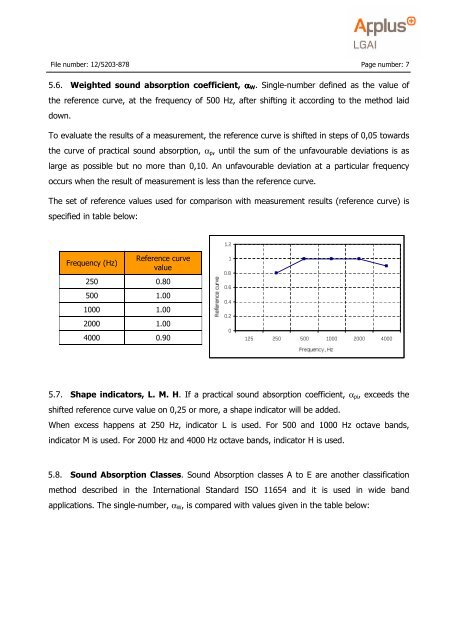
File number: 12/5203-878 Page number: 75.6. Weighted sound absorption coefficient, α W . Single-number defined as the value ofthe reference curve, at the frequency of 500 Hz, after shifting it according to the method laiddown.To evaluate the results of a measurement, the reference curve is shifted in steps of 0,05 towardsthe curve of practical sound absorption, α p , until the sum of the unfavourable deviations is aslarge as possible but no more than 0,10. An unfavourable deviation at a particular frequencyoccurs when the result of measurement is less than the reference curve.The set of reference values used for comparison with measurement results (reference curve) isspecified in table below:1.2Frequency (Hz)Reference curvevalue250 0.80500 1.001000 1.002000 1.004000 0.90Curva de referencia10.80.60.40.20125 250 500 1000 2000 4000Frequency, Frecuencia, Hz Hz5.7. Shape indicators, L. M. H. If a practical sound absorption coefficient, α pi , exceeds theshifted reference curve value on 0,25 or more, a shape indicator will be added.When excess happens at 250 Hz, indicator L is used. For 500 and 1000 Hz octave bands,indicator M is used. For 2000 Hz and 4000 Hz octave bands, indicator H is used.5.8. Sound Absorption Classes. Sound Absorption classes A to E are another classificationmethod described in the International Standard ISO 11654 and it is used in wide bandapplications. The single-number, α W , is compared with values given in the table below: