Watershed Report Card - Ausable Bayfield Conservation Authority
Watershed Report Card - Ausable Bayfield Conservation Authority
Watershed Report Card - Ausable Bayfield Conservation Authority

You also want an ePaper? Increase the reach of your titles
YUMPU automatically turns print PDFs into web optimized ePapers that Google loves.
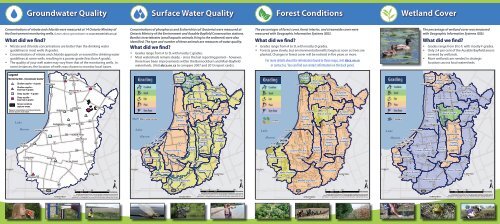
Groundwater QualitySurface Water QualityForest ConditionsWetland CoverConcentrations of nitrate and chloride were measured at 14 Ontario Ministry ofthe Environment monitoring wells. (Learn about groundwater at sourcewaterinfo.on.ca)What did we find?• Nitrate and chloride concentrations are better than the drinking waterguidelines in most wells (A grade).• Concentrations of nitrate and chloride approach or exceed the drinking waterguidelines at some wells, resulting in a poorer grade (less than A grade).• The quality of your well water may vary from that of the monitoring wells. Insome instances, the location of wells was chosen to monitor local issues.Concentrations of phosphorus and Escherichia coli (bacteria) were measured atOntario Ministry of the Environment and <strong>Ausable</strong> <strong>Bayfield</strong> <strong>Conservation</strong> stations.Benthic invertebrates (small aquatic animals living in the sediment) were alsoidentified. The type and number of these animals are measures of water quality.What did we find?• Grades range from A to D, with mostly C grades.• Most watersheds remain steady – since the last reporting period – however,there have been improvements within the Bannockburn and Main <strong>Bayfield</strong>watersheds. (Visit abca.on.ca to compare 2007 and 2013 report cards).The percentages of forest cover, forest interior, and streamside cover weremeasured with Geographic Information Systems (GIS).What did we find?• Grades range from A to D, with mostly D grades.• Forests grow slowly, but environmental benefits begin as soon as trees areplanted. Changes in forest cover will be noticed in five years or more.For more details about the information found in these maps, visit abca.on.caor contact us. You can find our contact information on the back panel.The percentage of wetland cover was measuredwith Geographic Information Systems (GIS).What did we find?• Grades range from B to F, with mostly F grades.• Only 2.4 per cent of the <strong>Ausable</strong> <strong>Bayfield</strong> area iscovered by wetlands.• More wetlands are needed in strategiclocations across local watersheds.