Policing Drug Hot-Spots - Center for Problem-Oriented Policing
Policing Drug Hot-Spots - Center for Problem-Oriented Policing
Policing Drug Hot-Spots - Center for Problem-Oriented Policing

Create successful ePaper yourself
Turn your PDF publications into a flip-book with our unique Google optimized e-Paper software.
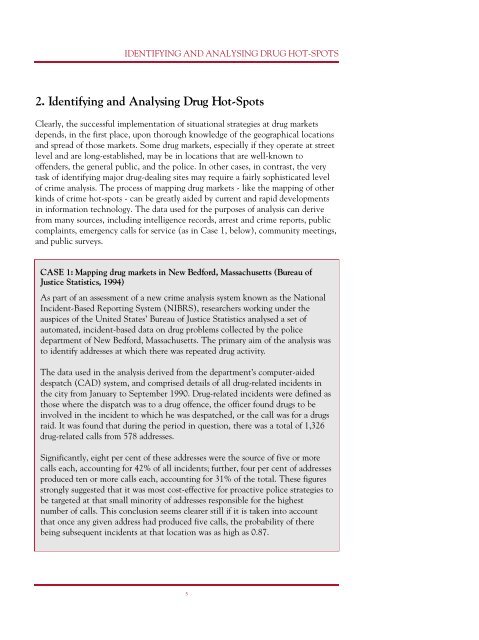
IDENTIFYING AND ANALYSING DRUG HOT-SPOTS2. Identifying and Analysing <strong>Drug</strong> <strong>Hot</strong>-<strong>Spots</strong>Clearly, the successful implementation of situational strategies at drug marketsdepends, in the first place, upon thorough knowledge of the geographical locationsand spread of those markets. Some drug markets, especially if they operate at streetlevel and are long-established, may be in locations that are well-known tooffenders, the general public, and the police. In other cases, in contrast, the verytask of identifying major drug-dealing sites may require a fairly sophisticated levelof crime analysis. The process of mapping drug markets - like the mapping of otherkinds of crime hot-spots - can be greatly aided by current and rapid developmentsin in<strong>for</strong>mation technology. The data used <strong>for</strong> the purposes of analysis can derivefrom many sources, including intelligence records, arrest and crime reports, publiccomplaints, emergency calls <strong>for</strong> service (as in Case 1, below), community meetings,and public surveys.CASE 1: Mapping drug markets in New Bed<strong>for</strong>d, Massachusetts (Bureau ofJustice Statistics, 1994)As part of an assessment of a new crime analysis system known as the NationalIncident-Based Reporting System (NIBRS), researchers working under theauspices of the United States’ Bureau of Justice Statistics analysed a set ofautomated, incident-based data on drug problems collected by the policedepartment of New Bed<strong>for</strong>d, Massachusetts. The primary aim of the analysis wasto identify addresses at which there was repeated drug activity.The data used in the analysis derived from the department’s computer-aideddespatch (CAD) system, and comprised details of all drug-related incidents inthe city from January to September 1990. <strong>Drug</strong>-related incidents were defined asthose where the dispatch was to a drug offence, the officer found drugs to beinvolved in the incident to which he was despatched, or the call was <strong>for</strong> a drugsraid. It was found that during the period in question, there was a total of 1,326drug-related calls from 578 addresses.Significantly, eight per cent of these addresses were the source of five or morecalls each, accounting <strong>for</strong> 42% of all incidents; further, four per cent of addressesproduced ten or more calls each, accounting <strong>for</strong> 31% of the total. These figuresstrongly suggested that it was most cost-effective <strong>for</strong> proactive police strategies tobe targeted at that small minority of addresses responsible <strong>for</strong> the highestnumber of calls. This conclusion seems clearer still if it is taken into accountthat once any given address had produced five calls, the probability of therebeing subsequent incidents at that location was as high as 0.87.5