Annual Report - City of Gosnells
Annual Report - City of Gosnells
Annual Report - City of Gosnells

You also want an ePaper? Increase the reach of your titles
YUMPU automatically turns print PDFs into web optimized ePapers that Google loves.
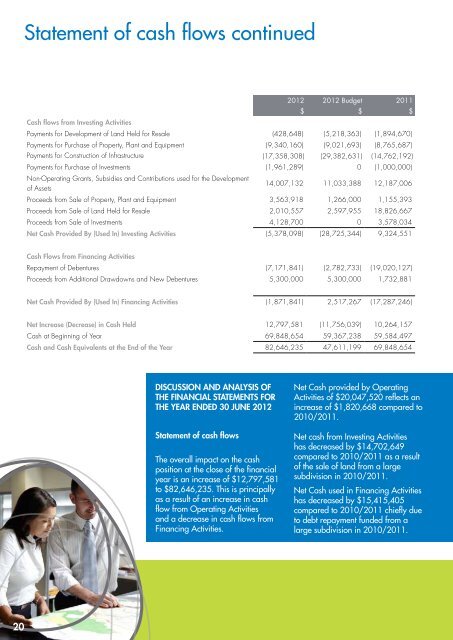
Statement <strong>of</strong> cash flows continued2012 2012 Budget 2011$ $ $Cash flows from Investing ActivitiesPayments for Development <strong>of</strong> Land Held for Resale (428,648) (5,218,363) (1,894,670)Payments for Purchase <strong>of</strong> Property, Plant and Equipment (9,340,160) (9,021,693) (8,765,687)Payments for Construction <strong>of</strong> Infrastructure (17,358,308) (29,382,631) (14,762,192)Payments for Purchase <strong>of</strong> Investments (1,961,289) 0 (1,000,000)Non-Operating Grants, Subsidies and Contributions used for the Development<strong>of</strong> Assets14,007,132 11,033,388 12,187,006Proceeds from Sale <strong>of</strong> Property, Plant and Equipment 3,563,918 1,266,000 1,155,393Proceeds from Sale <strong>of</strong> Land Held for Resale 2,010,557 2,597,955 18,826,667Proceeds from Sale <strong>of</strong> Investments 4,128,700 0 3,578,034Net Cash Provided By (Used In) Investing Activities (5,378,098) (28,725,344) 9,324,551Cash Flows from Financing ActivitiesRepayment <strong>of</strong> Debentures (7,171,841) (2,782,733) (19,020,127)Proceeds from Additional Drawdowns and New Debentures 5,300,000 5,300,000 1,732,881Net Cash Provided By (Used In) Financing Activities (1,871,841) 2,517,267 (17,287,246)Net Increase (Decrease) in Cash Held 12,797,581 (11,756,039) 10,264,157Cash at Beginning <strong>of</strong> Year 69,848,654 59,367,238 59,584,497Cash and Cash Equivalents at the End <strong>of</strong> the Year 82,646,235 47,611,199 69,848,654DISCUSSION AND ANALYSIS OFTHE FINANCIAL STATEMENTS FORTHE YEAR ENDED 30 JUNE 2012Statement <strong>of</strong> cash flowsThe overall impact on the cashposition at the close <strong>of</strong> the financialyear is an increase <strong>of</strong> $12,797,581to $82,646,235. This is principallyas a result <strong>of</strong> an increase in cashflow from Operating Activitiesand a decrease in cash flows fromFinancing Activities.Net Cash provided by OperatingActivities <strong>of</strong> $20,047,520 reflects anincrease <strong>of</strong> $1,820,668 compared to2010/2011.Net cash from Investing Activitieshas decreased by $14,702,649compared to 2010/2011 as a result<strong>of</strong> the sale <strong>of</strong> land from a largesubdivision in 2010/2011.Net Cash used in Financing Activitieshas decreased by $15,415,405compared to 2010/2011 chiefly dueto debt repayment funded from alarge subdivision in 2010/2011.