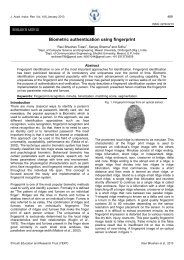
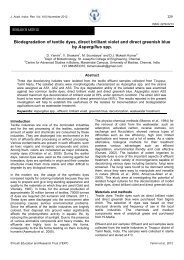
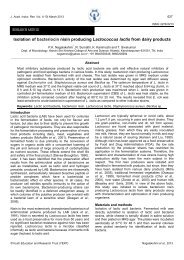
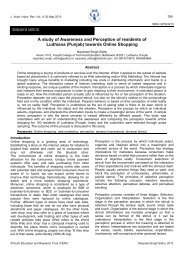
J. Acad. Indus. Res. Vol. 1(4) September 2012 184The solution was soaked <strong>for</strong> 1 d and 3 d respectively.After <strong>the</strong> soaking time, <strong>the</strong> solution was filtered usingWhatman No.1 filter paper and <strong>the</strong> filtrate solution washeated to 78C and 65C and made up to 50 mL withdistilled water and hexane and incubated <strong>for</strong> 2 h.Estimation <strong>of</strong> <strong>the</strong> compounds: Total phenolic content andcinnamaldehyde was estimated according to <strong>the</strong> method<strong>of</strong> Folin-Denis (Schanderl, 1970). Eugenol was estimatedaccording to <strong>the</strong> method <strong>of</strong> (Olcay, 1968).Results and discussionDifferent organic solvents such as methanol, ethanol,ethyl acetate and water were used to extract <strong>the</strong>optimum yield <strong>of</strong> cinnamaldehyde, total phenolic contentand eugenol from cinnamon species. Forcinnamaldehyde and total phenolic content, methanolshowed best results and <strong>the</strong> concentrations were 23.625mg/L, 9 mg/L respectively. For eugenol, ethanol showedbest results and its concentration was 12.4 mg/L (Fig. 1).The samples were incubated under proper conditions atdifferent time intervals viz., 1, 2, 3 and 4 d to investigate<strong>the</strong> influence on <strong>extraction</strong> <strong>of</strong> cinnamaldehyde and totalphenolic content and eugenol. It was observed that 3 rdwas <strong>the</strong> best soaking time <strong>for</strong> <strong>the</strong> <strong>extraction</strong> <strong>of</strong>cinnamaldehyde and total phenolic content and <strong>the</strong>concentrations were 30.2 mg/L, 10.8 mg/L. Second daywas suitable <strong>for</strong> <strong>the</strong> <strong>extraction</strong> <strong>of</strong> eugenol and itsconcentration was 12.5 mg/L (Fig. 2).To investigate <strong>the</strong> influence <strong>of</strong> hexane on <strong>extraction</strong> <strong>of</strong>cinnamaldehyde, total phenolic content and eugenoldifferent time intervals were taken viz., 1, 2, 3 and 4 h.Solvent-Solvent <strong>extraction</strong> was done with hexane as one<strong>of</strong> <strong>the</strong> solvent. The optimum concentrations wereobserved at 2 nd h and concentrations were 30.4 mg/L,10.9 mg/L and 12.6 mg/L respectively (Fig. 3). Differentparticle size viz., 354, 328, 250, 205, 149, 125 and 74microns were used to find out <strong>the</strong> optimumconcentrations <strong>of</strong> cinnamaldehyde, total phenolic contentand eugenol. The present investigation suggests that <strong>the</strong><strong>extraction</strong> <strong>of</strong> cinnamaldehyde, total phenolic content andeugenol at different particle sizes indicates that <strong>the</strong>optimum particle size was 125 microns <strong>for</strong> <strong>extraction</strong> <strong>of</strong>cinnamaldehyde, total phenolic content and eugenol. Theoptimum concentrations were 30.5 mg/L, 11 mg/L and12.8 mg/L (Fig. 4). Percentage <strong>of</strong> <strong>the</strong> solvent plays a vitalrole <strong>for</strong> <strong>the</strong> <strong>extraction</strong> <strong>of</strong> components. Different solvent(methanol and ethanol) percentages namely 0%, 20%,40%, 50%, 60%, 80% and 100% showed significantvariations. Figure 4 showed that optimum solventpercentages were at 50% methanol <strong>for</strong> bothcinnamaldehyde and total phenolic content and 80%ethanol <strong>for</strong> eugenol and <strong>the</strong> concentrations were 31mg/L, 11.2 mg/L and 13.5 mg/L respectively. Theobserved results <strong>for</strong> eugenol were found to becoincidence with <strong>the</strong> results obtained by Kamaliroosta etal. (2012) <strong>for</strong> cinnamaldehyde. The total phenolic contentresults coincide with <strong>the</strong> findings <strong>of</strong> Kubo et al. (1996)(Fig. 5).CA, TPC and Eugenol (mg/L)CA, TPC and Eugenol (mg/L)CA, TPC and Eugenol (mg/L)CA, TPC and Eugenol (mg/L)Fig. 1. Effect <strong>of</strong> different solvents <strong>for</strong> <strong>the</strong> <strong>extraction</strong> <strong>of</strong>phenolic components.Fig. 2. Effect <strong>of</strong> soaking time <strong>for</strong> <strong>the</strong> <strong>extraction</strong> <strong>of</strong>phenolic components.Soaking time (day)Fig. 3. Effect <strong>of</strong> <strong>extraction</strong> time with hexane <strong>for</strong> <strong>the</strong><strong>extraction</strong> <strong>of</strong> phenolic components.Extraction time (h)Fig. 4. Effect <strong>of</strong> different particle size <strong>for</strong> <strong>the</strong> <strong>extraction</strong> <strong>of</strong>phenolic components.Particle size (micron)©Youth Education and Research Trust (YERT) Sree Satya et al., 2012
J. Acad. Indus. Res. Vol. 1(4) September 2012 185To determine <strong>the</strong> volume <strong>of</strong> hexane <strong>for</strong> <strong>the</strong> <strong>extraction</strong> <strong>of</strong>cinnamaldehyde, total phenolic content and eugenol,different volumes <strong>of</strong> hexane with solvent (methanol andethanol) were made in <strong>the</strong> ratio 2:1, 1:1, 1:2 and 1:3.These different volumes and solvents (methanol andethanol) showed a significant effect on <strong>the</strong> <strong>extraction</strong>.The optimum <strong>extraction</strong> <strong>of</strong> cinnamaldehyde and totalphenolic content were achieved at 1:1 with methanol.The optimum concentrations were 32.5 mg/L, 11.8 mg/L.For eugenol, <strong>the</strong> optimum <strong>extraction</strong> was recorded at 1:1with ethanol and <strong>the</strong> concentration was 14.2 mg/L(Fig. 6). The findings <strong>of</strong> <strong>the</strong> study are in corroborationwith <strong>the</strong> report by Gulab et al. (2005). To determine <strong>the</strong>effect <strong>of</strong> pH on <strong>the</strong> <strong>extraction</strong> process, different pHvalues namely 5, 6, 7, 8, and 9 were used. It wasobserved that <strong>the</strong> <strong>extraction</strong> <strong>of</strong> cinnamaldehyde, totalphenolic content were found to be optimum at pH 8.0and optimum concentrations were 42.5 mg/L, 13.5 mg/L.The optimum pH <strong>for</strong> eugenol was 5 at an optimumconcentration <strong>of</strong> 14.6 mg/L (Fig. 7). The observed resultswere in accordance with <strong>the</strong> findings <strong>of</strong> Mattos et al.(2012) and Baseri et al. (2009).ConclusionIn this study <strong>the</strong> <strong>extraction</strong> <strong>of</strong> phenolic compounds likecinnamaldehyde, and eugenol were carried out.<strong>Optimization</strong> <strong>of</strong> <strong>physico</strong>-<strong>chemical</strong> <strong>parameters</strong> namelyeffects <strong>of</strong> different solvents, soaking time, <strong>extraction</strong> timewith hexane, particle size, different solvent percentages,different volumes <strong>of</strong> hexane with methanol and ethanolas solvents and pH <strong>for</strong> <strong>the</strong> <strong>extraction</strong> <strong>of</strong> cinnamaldehyde,total phenolic content and eugenol were studied. For <strong>the</strong><strong>extraction</strong> <strong>of</strong> cinnamaldehyde, <strong>the</strong> optimum results were3 d, 2 h, 125 microns, 50% (v/v), 1:1 ratio and pH 5respectively. The highest cinnamaldehyde concentration<strong>for</strong> optimized conditions was 44.6 mg/L and <strong>for</strong> totalphenolic content it was 13.5 mg/L. The highest eugenolconcentration <strong>for</strong> optimized conditions was 14.6 mg/L.References1. Akbari, S., Mohammad Khoshnod, J., Rajaian, H. andAfsharnasab, M. 2010. The use <strong>of</strong> eugenol as an anes<strong>the</strong>tic intransportation <strong>of</strong> with Indian shrimp (Fenneropenaeus indicus)post larvae. Turk. J. Fisheries Aquatic Sci. 10: 423-429.2. Baseri, H., Haghighi-Asl, A. and Mohmmad Lotfollahi, N. 2009.Effects <strong>of</strong> operating <strong>parameters</strong> on <strong>the</strong> cinnamaldehyde content<strong>of</strong> extracted essential oil using various methods. Chem. Engg.Technol. 33(2): 267-274.3. El-Baroty, G.S., Abd El-Baky, H.H., Farag, R.S. and Saleh,M.A. 2010. Characterzation <strong>of</strong> antioxidant and antimicrobialcompounds <strong>of</strong> cinnamon and ginger essential oils. Afri. J.Biochem. Res. 4(6): 167-174.4. Gulab Jham, N., Onkar Dhingra, D., Carolina Jardim, M. andValente, M.M. 2005. Identification <strong>of</strong> <strong>the</strong> major fungitoxiccomponent <strong>of</strong> cinnamon bark oil. Fitopatologia Brasileira. 30:404-408.5. Jaganathan, S.K. and Supriyanto, E. 2012. Antiproliferativeand molecular mechanism <strong>of</strong> eugenol-induced apoptosis incancer cells. Mol. 17: 6290-6304.6. Kamaliroosta, L., Gharachorloo, M., Kamaliroosta, Z. AndAlimohammad Zadeh, K. 2012. Extraction <strong>of</strong> cinnamonessential oil and identification <strong>of</strong> its <strong>chemical</strong> compounds. J.Med. Plants Res. 6(4): 609-614.CA, TPC and Eugenol (mg/L)CA, TPC and Eugenol (mg/L)Fig. 5. Effect <strong>of</strong> solvent percentages <strong>for</strong> <strong>the</strong> <strong>extraction</strong> <strong>of</strong>phenolic components.Solvent percentageFig. 6. Effect <strong>of</strong> different volumes <strong>of</strong> hexane with solvents<strong>for</strong> <strong>the</strong> <strong>extraction</strong> <strong>of</strong> phenolic components.2:1 1:1 1:2 1:3Ratio <strong>of</strong> hexane with solvents7. Koppikar, J., Amit Choudari, S., Snehal Suryavashi, A., ShwetaKumari, Chattopadhyay, S. and Kaul-Ghanekar, R. 2010.Aqeous cinnamon extract (ACE-c) from <strong>the</strong> bark <strong>of</strong>Cinnamomum cassia causes apoptosis in human cervicalcancer cell line (SiHa) through loss <strong>of</strong> mitochondrial membranepotential. BMC Cancer. 10: 210.8. Kubo, M., Ma, S., Wu, J. and Matsuda, H. 1996.Antiinflammatory activities <strong>of</strong> 70% methanolic extract <strong>of</strong>cinnamomi cortex. Biol. Pharm. Bull. 19: 1041-1045.9. Mattos, D., Danilo Florisvaldo, B., Josianne Arantes Do, N.,Nadia Nara, B. and Roberta, H. 2012. Cinnamon essential oiland cinnamaldehyde in <strong>the</strong> control <strong>of</strong> bacterial bi<strong>of</strong>ilms <strong>for</strong>medon stainless steel surfaces. Eur. Food Res. Technol. 234: 821-832.10. Meena, V., Sree Satya, N., Surya Prakash, DV. and Sumanjali,A. 2012. A review on pharmacological activities and clinicaleffects <strong>of</strong> cinnamon species. Res. J. Pharm. Biol. Chem. Sci.3(1): 653-663.11. Mikaili, P., Shayegh, J., Sarahroodi, S. and Sharifi, M. 2012.Pharmacological properties <strong>of</strong> herbal oil extracts used inIranian traditional medicine. Adv. Environ. Biol. 6(1): 153-158.12. Moselhy, S. and Husein Ali, K.H. 2009. Hepato protectiveeffect <strong>of</strong> cinnamon extracts against carbon tetrachlorideinduced oxidative stress and liver injury in rats. Biol. Res. 42:93-98.13. Olcay, A. 1968. Spectrophotometric determination <strong>of</strong>eugenol. La Revue “Communications de la Faculté desSciences de l’Universite D’Ankara. pp.85-91.14. Schanderl, S.H. 1970. In: Method in food analysis academicpress, New York. p.709.15. Verspohl, E., Katrin Bauer, J. and Neddermann, E. 2005.Antidiabetic effect <strong>of</strong> Cinnamomum cassia and Cinnamomumzeylanicum in vivo and in vitro. Phyto<strong>the</strong>r. Res. 19(3): 203-206.©Youth Education and Research Trust (YERT) Sree Satya et al., 2012