- Page 2 and 3:
Outline• What is Low-Level Analys
- Page 4 and 5:
High-Level Analysis• Clustering/C
- Page 6 and 7:
Brief TechnologyOverview• High de
- Page 8 and 9:
Two Probe TypesPM: the Perfect Matc
- Page 10 and 11:
Focusing on a SingleGeneChip Cell L
- Page 12 and 13:
Hybridization to the Chip
- Page 14 and 15:
Chip dat file - checkered board - o
- Page 16 and 17:
Chip dat file - checkered board - c
- Page 18 and 19:
Constructing a geneexpression measu
- Page 20 and 21:
Background/SignalAdjustment• A me
- Page 22 and 23:
Normalization“Non-biological fact
- Page 24 and 25:
Summarization• Reduce the 11-20 p
- Page 26 and 27:
Affymetrix Spike-in Data• 59 chip
- Page 28 and 29:
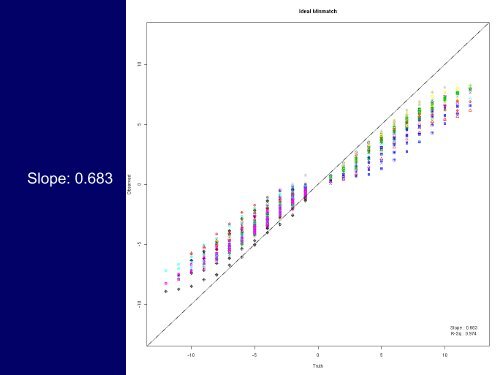
Assessing Bias:Observed Expression
- Page 30:
Assessing Variability:M vs A plots
- Page 38 and 39:
Summary of Trade-offsBackgroundMeth
- Page 43 and 44:
Scaling is Not Sufficient
- Page 45 and 46:
Little effect on Spike-insMethodAll
- Page 47 and 48:
Comparing EstablishedExpression Mea
- Page 49 and 50:
General Probe LevelModelyij= f( X)+
- Page 51 and 52:
Fitting the PLM• Robust regressio
- Page 53 and 54:
Fold ChangeFC = X − XlmWhereXl=
- Page 55 and 56:
“Robust” t-statistict=Xlsnm2s2l
- Page 57 and 58:
Limma “ebayes” t-statistic• G
- Page 59 and 60:
Probe Level Model teststatisticstPL
- Page 65: What Happens as the Numberof Arrays
- Page 71 and 72: ResultsMethod Individual Models Sin
- Page 75 and 76: What is going on here?• Examine r
- Page 77 and 78: Low Non-Differential
- Page 79 and 80: High Non-Differential
- Page 81 and 82: GeneLogic Tonsil dataset
- Page 83 and 84: ResultsMethod 3 vs 3 4 vs 4 5 vs 50
- Page 86 and 87: Ongoing work in this area• Techno
- Page 88 and 89: Additional Slides
- Page 90 and 91: Original RMA Background• Convolut
- Page 92 and 93: A Standard Curve AdjustmentBased on
- Page 94 and 95: γRelates to Concentration
- Page 96 and 97: The Two Curves Yield anAdjustment C
- Page 98 and 99: Sort columns of of originalmatrixTa
- Page 100 and 101: RMA Model• To each probeset (k),
- Page 102 and 103: Basic RMA modelLetthenyij= log N B2
- Page 104 and 105: SlopeAllMidLowHighValue0.4930.6650.
- Page 106 and 107: SlopeAllMidLowHighValue0.5890.7510.
- Page 108 and 109: SlopeAllMidLowHighValue0.6950.820.5
- Page 110 and 111: Slope: 0.484
- Page 114 and 115: Slope: 0.692