

The Chemistry of Signal Transduction in the TetR ... - Beilstein-Institut
The Chemistry of Signal Transduction in the TetR ... - Beilstein-Institut
The Chemistry of Signal Transduction in the TetR ... - Beilstein-Institut

Create successful ePaper yourself
Turn your PDF publications into a flip-book with our unique Google optimized e-Paper software.
176<br />
Lanig, H. and Clark, T.<br />
crystal-pack<strong>in</strong>g forces. <strong>The</strong> structures <strong>of</strong> signal-transduction prote<strong>in</strong>s <strong>in</strong> crystals will <strong>the</strong>refore<br />
be perturbed quite strongly from <strong>the</strong>ir solution conformations and cannot be expected to<br />
reproduce <strong>the</strong> <strong>in</strong>duction state <strong>of</strong> <strong>the</strong> prote<strong>in</strong> correctly. Note, for <strong>in</strong>stance, that if <strong>the</strong> first five<br />
X-ray structures <strong>of</strong> <strong>TetR</strong> had been used to propose a mechanism, we would have concluded<br />
that <strong>the</strong> R(a3-a3’) distance <strong>in</strong> <strong>the</strong> non-<strong>in</strong>duced form is larger than <strong>in</strong> <strong>the</strong> <strong>in</strong>duced one – <strong>the</strong><br />
reverse <strong>of</strong> what we now believe.<br />
Determ<strong>in</strong><strong>in</strong>g Induction from MD Simulations<br />
Molecular dynamics simulations <strong>of</strong>fer a possible alternative for determ<strong>in</strong><strong>in</strong>g <strong>the</strong> <strong>in</strong>duction<br />
state <strong>of</strong> <strong>TetR</strong>. However, for this to be <strong>the</strong> case, <strong>the</strong> allosteric rearrangement must take place<br />
on a time scale that makes it probable with<strong>in</strong> <strong>the</strong> length <strong>of</strong> a simulation, which <strong>in</strong> our case is<br />
50 – 100 ns. We will show below that, contrary to our expectations, this is <strong>the</strong> case.<br />
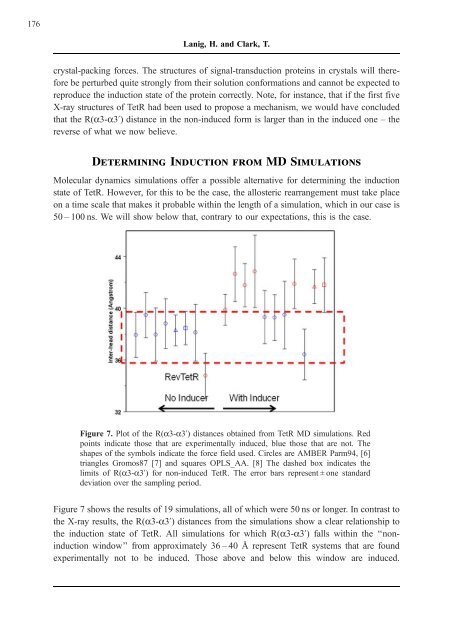
Figure 7. Plot <strong>of</strong> <strong>the</strong> R(a3-a3’) distances obta<strong>in</strong>ed from <strong>TetR</strong> MD simulations. Red<br />
po<strong>in</strong>ts <strong>in</strong>dicate those that are experimentally <strong>in</strong>duced, blue those that are not. <strong>The</strong><br />
shapes <strong>of</strong> <strong>the</strong> symbols <strong>in</strong>dicate <strong>the</strong> force field used. Circles are AMBER Parm94, [6]<br />
triangles Gromos87 [7] and squares OPLS_AA. [8] <strong>The</strong> dashed box <strong>in</strong>dicates <strong>the</strong><br />
limits <strong>of</strong> R(a3-a3’) for non-<strong>in</strong>duced <strong>TetR</strong>. <strong>The</strong> error bars represent ± one standard<br />
deviation over <strong>the</strong> sampl<strong>in</strong>g period.<br />
Figure 7 shows <strong>the</strong> results <strong>of</strong> 19 simulations, all <strong>of</strong> which were 50 ns or longer. In contrast to<br />
<strong>the</strong> X-ray results, <strong>the</strong> R(a3-a3’) distances from <strong>the</strong> simulations show a clear relationship to<br />
<strong>the</strong> <strong>in</strong>duction state <strong>of</strong> <strong>TetR</strong>. All simulations for which R(a3-a3’) falls with<strong>in</strong> <strong>the</strong> ‘‘non<strong>in</strong>duction<br />
w<strong>in</strong>dow’’ from approximately 36 – 40 A˚ represent <strong>TetR</strong> systems that are found<br />
experimentally not to be <strong>in</strong>duced. Those above and below this w<strong>in</strong>dow are <strong>in</strong>duced.