The Yale-Brown Obsessive Compulsive Scale - University of ...
The Yale-Brown Obsessive Compulsive Scale - University of ...
The Yale-Brown Obsessive Compulsive Scale - University of ...

Create successful ePaper yourself
Turn your PDF publications into a flip-book with our unique Google optimized e-Paper software.
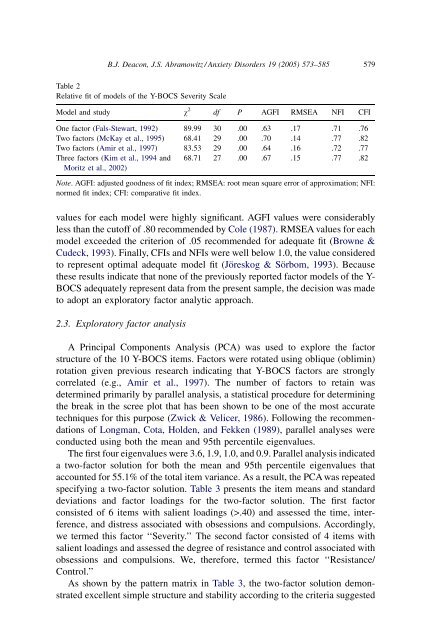
B.J. Deacon, J.S. Abramowitz / Anxiety Disorders 19 (2005) 573–585 579Table 2Relative fit <strong>of</strong> models <strong>of</strong> the Y-BOCS Severity <strong>Scale</strong>Model and study w 2 df P AGFI RMSEA NFI CFIOne factor (Fals-Stewart, 1992) 89.99 30 .00 .63 .17 .71 .76Two factors (McKay et al., 1995) 68.41 29 .00 .70 .14 .77 .82Two factors (Amir et al., 1997) 83.53 29 .00 .64 .16 .72 .77Three factors (Kim et al., 1994 andMoritz et al., 2002)68.71 27 .00 .67 .15 .77 .82Note. AGFI: adjusted goodness <strong>of</strong> fit index; RMSEA: root mean square error <strong>of</strong> approximation; NFI:normed fit index; CFI: comparative fit index.values for each model were highly significant. AGFI values were considerablyless than the cut<strong>of</strong>f <strong>of</strong> .80 recommended by Cole (1987). RMSEA values for eachmodel exceeded the criterion <strong>of</strong> .05 recommended for adequate fit (<strong>Brown</strong>e &Cudeck, 1993). Finally, CFIs and NFIs were well below 1.0, the value consideredto represent optimal adequate model fit (Jöreskog & Sörbom, 1993). Becausethese results indicate that none <strong>of</strong> the previously reported factor models <strong>of</strong> the Y-BOCS adequately represent data from the present sample, the decision was madeto adopt an exploratory factor analytic approach.2.3. Exploratory factor analysisA Principal Components Analysis (PCA) was used to explore the factorstructure <strong>of</strong> the 10 Y-BOCS items. Factors were rotated using oblique (oblimin)rotation given previous research indicating that Y-BOCS factors are stronglycorrelated (e.g., Amir et al., 1997). <strong>The</strong> number <strong>of</strong> factors to retain wasdetermined primarily by parallel analysis, a statistical procedure for determiningthe break in the scree plot that has been shown to be one <strong>of</strong> the most accuratetechniques for this purpose (Zwick & Velicer, 1986). Following the recommendations<strong>of</strong> Longman, Cota, Holden, and Fekken (1989), parallel analyses wereconducted using both the mean and 95th percentile eigenvalues.<strong>The</strong> first four eigenvalues were 3.6, 1.9, 1.0, and 0.9. Parallel analysis indicateda two-factor solution for both the mean and 95th percentile eigenvalues thataccounted for 55.1% <strong>of</strong> the total item variance. As a result, the PCA was repeatedspecifying a two-factor solution. Table 3 presents the item means and standarddeviations and factor loadings for the two-factor solution. <strong>The</strong> first factorconsisted <strong>of</strong> 6 items with salient loadings (>.40) and assessed the time, interference,and distress associated with obsessions and compulsions. Accordingly,we termed this factor ‘‘Severity.’’ <strong>The</strong> second factor consisted <strong>of</strong> 4 items withsalient loadings and assessed the degree <strong>of</strong> resistance and control associated withobsessions and compulsions. We, therefore, termed this factor ‘‘Resistance/Control.’’As shown by the pattern matrix in Table 3, the two-factor solution demonstratedexcellent simple structure and stability according to the criteria suggested