The Disgust Propensity and Sensitivity Scale-Revised - University of ...
The Disgust Propensity and Sensitivity Scale-Revised - University of ...
The Disgust Propensity and Sensitivity Scale-Revised - University of ...
- No tags were found...

Create successful ePaper yourself
Turn your PDF publications into a flip-book with our unique Google optimized e-Paper software.
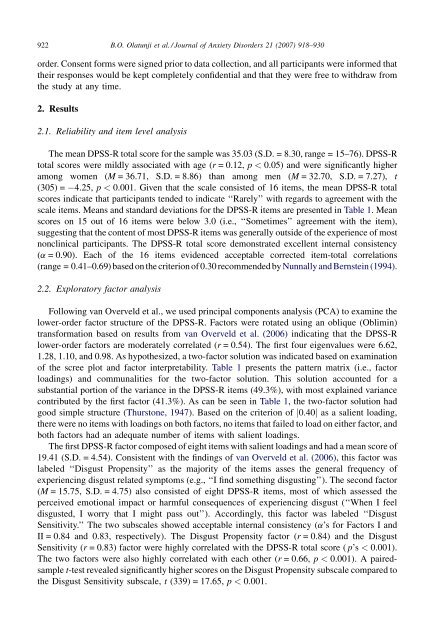
922B.O. Olatunji et al. / Journal <strong>of</strong> Anxiety Disorders 21 (2007) 918–930order. Consent forms were signed prior to data collection, <strong>and</strong> all participants were informed thattheir responses would be kept completely confidential <strong>and</strong> that they were free to withdraw fromthe study at any time.2. Results2.1. Reliability <strong>and</strong> item level analysis<strong>The</strong> mean DPSS-R total score for the sample was 35.03 (S.D. = 8.30, range = 15–76). DPSS-Rtotal scores were mildly associated with age (r = 0.12, p < 0.05) <strong>and</strong> were significantly higheramong women (M = 36.71, S.D. = 8.86) than among men (M = 32.70, S.D. = 7.27), t(305) = 4.25, p < 0.001. Given that the scale consisted <strong>of</strong> 16 items, the mean DPSS-R totalscores indicate that participants tended to indicate ‘‘Rarely’’ with regards to agreement with thescale items. Means <strong>and</strong> st<strong>and</strong>ard deviations for the DPSS-R items are presented in Table 1.Meanscores on 15 out <strong>of</strong> 16 items were below 3.0 (i.e., ‘‘Sometimes’’ agreement with the item),suggesting that the content <strong>of</strong> most DPSS-R items was generally outside <strong>of</strong> the experience <strong>of</strong> mostnonclinical participants. <strong>The</strong> DPSS-R total score demonstrated excellent internal consistency(a = 0.90). Each <strong>of</strong> the 16 items evidenced acceptable corrected item-total correlations(range = 0.41–0.69) based on the criterion <strong>of</strong> 0.30 recommended by Nunnally <strong>and</strong> Bernstein (1994).2.2. Exploratory factor analysisFollowing van Overveld et al., we used principal components analysis (PCA) to examine thelower-order factor structure <strong>of</strong> the DPSS-R. Factors were rotated using an oblique (Oblimin)transformation based on results from van Overveld et al. (2006) indicating that the DPSS-Rlower-order factors are moderately correlated (r = 0.54). <strong>The</strong> first four eigenvalues were 6.62,1.28, 1.10, <strong>and</strong> 0.98. As hypothesized, a two-factor solution was indicated based on examination<strong>of</strong> the scree plot <strong>and</strong> factor interpretability. Table 1 presents the pattern matrix (i.e., factorloadings) <strong>and</strong> communalities for the two-factor solution. This solution accounted for asubstantial portion <strong>of</strong> the variance in the DPSS-R items (49.3%), with most explained variancecontributed by the first factor (41.3%). As can be seen in Table 1, the two-factor solution hadgood simple structure (Thurstone, 1947). Based on the criterion <strong>of</strong> j0.40j as a salient loading,there were no items with loadings on both factors, no items that failed to load on either factor, <strong>and</strong>both factors had an adequate number <strong>of</strong> items with salient loadings.<strong>The</strong> first DPSS-R factor composed <strong>of</strong> eight items with salient loadings <strong>and</strong> had a mean score <strong>of</strong>19.41 (S.D. = 4.54). Consistent with the findings <strong>of</strong> van Overveld et al. (2006), this factor waslabeled ‘‘<strong>Disgust</strong> <strong>Propensity</strong>’’ as the majority <strong>of</strong> the items asses the general frequency <strong>of</strong>experiencing disgust related symptoms (e.g., ‘‘I find something disgusting’’). <strong>The</strong> second factor(M = 15.75, S.D. = 4.75) also consisted <strong>of</strong> eight DPSS-R items, most <strong>of</strong> which assessed theperceived emotional impact or harmful consequences <strong>of</strong> experiencing disgust (‘‘When I feeldisgusted, I worry that I might pass out’’). Accordingly, this factor was labeled ‘‘<strong>Disgust</strong><strong>Sensitivity</strong>.’’ <strong>The</strong> two subscales showed acceptable internal consistency (a’s for Factors I <strong>and</strong>II = 0.84 <strong>and</strong> 0.83, respectively). <strong>The</strong> <strong>Disgust</strong> <strong>Propensity</strong> factor (r = 0.84) <strong>and</strong> the <strong>Disgust</strong><strong>Sensitivity</strong> (r = 0.83) factor were highly correlated with the DPSS-R total score ( p’s < 0.001).<strong>The</strong> two factors were also highly correlated with each other (r = 0.66, p < 0.001). A pairedsamplet-test revealed significantly higher scores on the <strong>Disgust</strong> <strong>Propensity</strong> subscale compared tothe <strong>Disgust</strong> <strong>Sensitivity</strong> subscale, t (339) = 17.65, p < 0.001.