72[4] Sector Response plans United Nations and Partners<strong>SUDAN</strong> WORK PLAN 2013The provision of environmentally friendly shelter is tracked bypartner reports on distribution figures on a quarterly basis.Linkages with other sectorsThe NFI and ES Sector interventions are closely linked withfood distribution by WFP (FSL Sector), the activities of the newLogistics and Emergency Telecommunications Sector, andwith the provision of other non-food items not provided by thecommon pipeline such as soap and mosquito nets, distributedby the Protection and WASH Sectors. The NFI and ES Sectorwill engage in dialogue with these other sectors to better align/coordinate all NFI distributions to vulnerable populations.Key sector informationLead agencyUnited Nations Children’s Fund (UNICEF)Government lead Nutrition Directorate, Ministry of HealthImplementingagenciesAMVO, ARC, CIS, COSV, CW, GOAL, HAI, IMC UK,JUH, KPHF, MERLIN, NCA, RI, SAN, SC, Sibro, SudanRC, TEARFUND, TOD, UNICEF, WFP, WHO, WorldRelief, WVS.Projects 24Beneficiaries 2,472,231Funds requested $48,576,455Funds requestedper priority levelContact infoHigh: 14 projects ($42,891,527 – 88%)Medium: 10 projects ($5,769,535 – 12%)Susan Lillicrap: slillicrap@unicef.orgDr. Wafaa Badawi: wafaabed@yahoo.com, 0122227869Activities outside of the 2013 Work PlanHAC at federal and state levels provides NFIs for small-scaledisasters (mainly floods). The NFI and ES sector continues tocoordinate with HAC at both federal and state levels in thecase of response to large-scale disasters. The sector, as the“provider of last resort” for the rest of Sudan, participates in allinter-agency responses to disaster involving thr Governmentof Sudan, UN agencies and NGOs.The International Committee of the Red Cross (ICRC) providesNFIs mainly to people displaced as a result of conflict, as doesthe International Federation of the Red Cross (IFRC), whichoperates through the Sudanese Red Crescent Society (SRCS).nutritionhSector objectives1. Contribute to improved access to quality management ofacute malnutrition for populations with critical nutritionsituations or conflict affected areas.2. Contribute to strengthening of Ministry of Health (MOH)and partners capacity to identify, prepare for and mitigatenutrition problems in emergencies.3. Increase access to evidence based and high impactpreventative nutrition services by empowering communitiesand finding durable solutions.Sector needs analysisCategoryChildren withModerateAcuteMalnutrition(MAM) 19People in needTargeted beneficiariesFemale Male Total Female Male Total753,120 753,120 1,506,240 94,680 94,680 189,360Children withSevere Acute 244,915 244,915 489,830 50,000 50,000 100,000MalnutritionPregnantand lactatingwomen(PLW) in 487,698 - 487,698 171,889 - 171,889states 20conflictaffectedChildrenunder fivein conflictaffectedStates 21 1,005,491 1,005,491 2,010,982 1,005,491 1,005,491 2,010,982Total 2,491,224 2,003,526 4,494,750 1,322,060 1,150,171 2,472,231Localised surveys conducted in the Darfur region and GedarefState in 2012 show that the nutrition situation has remainedlargely unchanged. The nutrition sector is characterised byseasonal trends and is above the 15% international emergencythreshold for acute malnutrition in the majority of locations.Of the 19 surveys conducted in Darfur region so far during2012, global acute malnutrition (GAM) results range from alow of 7.3% (South Darfur, post-harvest) to a high of 32.4%(North Darfur, during the hunger gap). Four surveys havebeen conducted outside of Darfur (three in Gedaref State andNutrition Services and IndicatorsNumber of Darfur nutrition centresTherapeutic ● and supplementary ● feeding centres350335 350311 317 318321300290 290272 274 278206 208 217 227 238 216 212 227 247 26125022720015010050Severe acute malnutrition (SAM) admissionsNational admissions per month (in thousands)2012201120101086420Nov-08Jan-09Mar-09Jun-09Aug-09Jan-10Mar-10Jun-10Aug-10Sep-10Dec-10Mar-11Jun-11Jul-11Aug-11Sep-11Oct-11Nov-11Dec-11Mar-12Jun-12Sep-12JanFebMarAprMayJunJulAugSepOctNovDec0Source: Ministry of Health, UNICEF (2012)
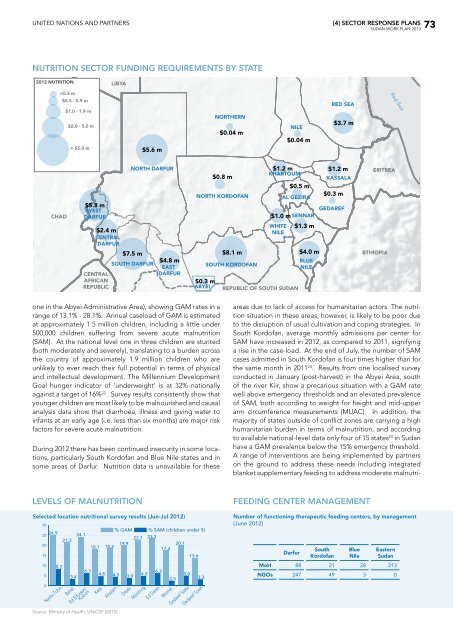
United Nations and Partners[4] Sector Response Plans<strong>SUDAN</strong> WORK PLAN 201373NUTRITION SECTOR funding requirements by state2013 NUTRITIONLIBYA>0.5 mRed Sea$0.5 - 0.9 m$1.0 - 1.9 m$2.0 - 5.0 m> $5.0 m$5.6 mNORTHERN$0.04 mNILE$0.04 mRED SEA$3.7 mCHAD$5.8 mWESTDARFURNORTH DARFUR$0.8 mNORTH KORDOFAN$2.4 mCENTRALDARFUR$7.5 m $8.1 mSOUTH DARFUR$4.8 mEASTSOUTH KORDOFANCENTRALDARFURAFRICANREPUBLIC$0.3 mABYEI$1.2 mKHARTOUMAL GEZIRAREPUBLIC OF SOUTH <strong>SUDAN</strong>$0.5 m$4.0 mBLUENILE$1.2 mKASSALA$0.3 mGEDAREF$1.0 m SENNARWHITE $1.3 mNILEERITREAETHIOPIAone in the Abyei Administrative Area), showing GAM rates in arange of 13.1% - 28.1%. Annual caseload of GAM is estimatedat approximately 1.5 million children, including a little under500,000 children suffering from severe acute malnutrition(SAM). At the national level one in three children are stunted(both moderately and severely), translating to a burden acrossthe country of approximately 1.9 million children who areunlikely to ever reach their full potential in terms of physicaland intellectual development. The Millennium DevelopmentGoal hunger indicator of ‘underweight’ is at 32% nationallyagainst a target of 16% 22 . Survey results consistently show thatyounger children are most likely to be malnourished and causalanalysis data show that diarrhoea, illness and giving water toinfants at an early age (i.e. less than six months) are major riskfactors for severe acute malnutrition.During 2012 there has been continued insecurity in some locations,particularly South Kordofan and Blue Nile states and insome areas of Darfur. Nutrition data is unavailable for theseareas due to lack of access for humanitarian actors. The nutritionsituation in these areas, however, is likely to be poor dueto the disruption of usual cultivation and coping strategies. InSouth Kordofan, average monthly admissions per center forSAM have increased in 2012, as compared to 2011, signifyinga rise in the case-load. At the end of July, the number of SAMcases admitted in South Kordofan is four times higher than forthe same month in 2011 23 . Results from one localised surveyconducted in January (post-harvest) in the Abyei Area, southof the river Kiir, show a precarious situation with a GAM ratewell above emergency thresholds and an elevated prevalenceof SAM, both according to weight for height and mid-upperarm circumference measurements (MUAC). In addition, themajority of states outside of conflict zones are carrying a highhumanitarian burden in terms of malnutrition, and accordingto available national-level data only four of 15 states 24 in Sudanhave a GAM prevalence below the 15% emergency threshold.A range of interventions are being implemented by partnerson the ground to address these needs including integratedblanket supplementary feeding to address moderate malnutrilevelsof malnutritionSelected location nutritional survey results (Jun-Jul 2012)3024.92521.3201510508.23.424.16.3Source: Ministry of Health, UNICEF (2012)% GAM % SAM (children under 5)22.7 23.319.920.118.1 18.417.413.64.8 4.5 3.94.96.32.55.03.3Nyala-TulusBelielEd Elfursan/KubumKassAlsalamOtashMershingEd DaienMorneiGedaref StateGedaref Townfeeding center managementNumber of functioning therapeutic feeding centers, by management(June 2012)DarfurSouthKordofanBlueNileEasternSudanMoH 88 21 28 213NGOs 247 49 3 0