Expectations
View - Durham Regional Police Service
View - Durham Regional Police Service
- No tags were found...

You also want an ePaper? Increase the reach of your titles
YUMPU automatically turns print PDFs into web optimized ePapers that Google loves.
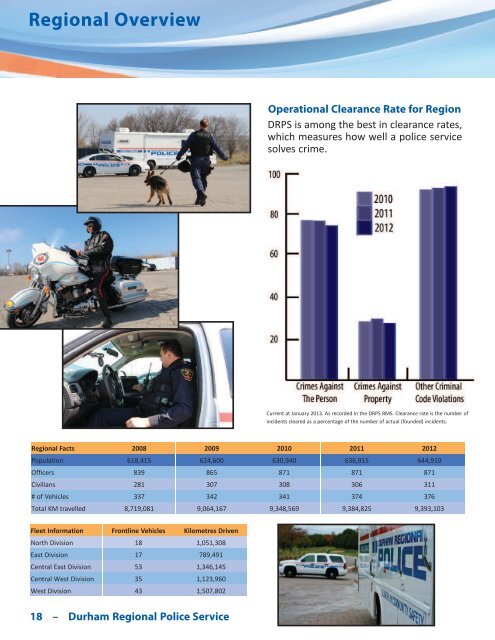
Regional OverviewRegional OverviewOperational Clearance Rate for RegionDRPS is among the best in clearance rates,which measures how well a police servicesolves crime.Current at January 2013. As recorded in the DRPS RMS. Clearance rate is the number ofincidents cleared as a percentage of the number of actual (founded) incidents.Regional Facts 2008 2009 2010 2011 2012Population 618,415 624,600 630,940 636,915 644,910Officers 839 865 871 871 871Civilians 281 307 308 306 311# of Vehicles 337 342 341 374 376Total KM travelled 8,719,081 9,064,167 9,348,569 9,384,825 9,393,103Fleet Information Frontline Vehicles Kilometres DrivenNorth Division 18 1,051,308East Division 17 789,491Central East Division 53 1,346,145Central West Division 35 1,123,960West Division 43 1,507,802REPORTED OR KNOWN VIOLATIONS 2008 2009 2010 2011 2012 % Change from 2011TOTAL CRIMINAL CODE VIOLATIONS (MINUS TRAFFIC) 34,226 31,780 29,083 27,568 24,868 -9.8CRIMES AGAINST THE PERSON 6,259 6,166 5,688 5,590 5,191 -7.1Violations Causing Death * 7 7 7 4 4 0.0Attempting the Commission of a Capital Crime 3 6 3 2 2 0.0Sexual Violations 561 584 577 505 523 3.6Sexual Assault 420 427 405 365 374 2.5Luring a Child via Computer 16 11 12 22 22 0.0Other Sexual Violations 125 146 160 118 127 7.6Assaults 3089 3035 2806 2653 2433 -8.3Aggravated Assault Level 3 70 57 46 40 40 0.0Assault with Weapon/Bodily Harm Level 2 565 561 593 468 447 -4.5Assault Level 1 2191 2182 1956 1964 1808 -7.9Discharge Firearm with Intent 4 9 10 6 6 0.0Using Firearm/Imitation in Commission of Offence 17 19 25 10 10 0.0Pointing a Firearm 13 24 22 19 12 -36.8Assault against Peace Public Officer 149 121 109 98 85 -13.3All Other Assaults 80 62 45 48 25 -47.9Deprivation of Freedom 83 83 66 72 67 -6.9Robbery 501 530 416 393 390 -0.8Harassing Phone Calls 633 576 553 675 596 -11.7Utter Threats to Person 970 906 841 789 722 -8.5Criminal Harassment 350 386 381 446 405 -9.2All Other Violent Violations 62 53 38 51 49 -3.9CRIMES AGAINST PROPERTY 21,262 19,848 17,646 16,709 15,245 -8.8Arson 78 91 61 58 57 -1.7Break and Enter 2591 2422 1876 1679 1592 -5.2Motor Vehicle Theft 1186 823 711 635 474 -25.4Theft From a Motor Vehicle 3121 3266 2960 2546 2503 -1.7Theft 4557 4233 3815 3805 3329 -12.5Shoplifting 1455 1472 1671 1485 1317 -11.3Have Stolen Goods 1238 1342 1263 1421 1103 -22.4Fraud 2414 1991 1649 1708 1576 -7.7Mischief 4622 4208 3640 3372 3294 -2.3OTHER CRIMINAL CODE VIOLATIONS 6,705 5,766 5,749 5,269 4,432 -15.9Prostitution 67 96 241 89 77 -13.5Gaming and Betting 12 1 5 5 0 -100.0Offensive Weapons 465 476 500 425 293 -31.1Possession of Weapons 409 427 422 362 254 -29.8All Other Offensive Weapons 56 49 78 63 39 -38.1Fail to Comply with Conditions 2084 2039 1929 1774 1508 -15.0Production/Distribution of Child Pornography 28 21 40 51 46 -9.8Obstruct Public Peace Officer 237 269 259 232 185 -20.3Breach of Probation 1339 1178 1043 1144 1008 -11.9All Other Criminal Code 2473 1686 1732 1549 1315 -15.1* Includes Murder 1st Degree, Murder 2nd Degree, Manslaughter, Infanticide, Criminal Negligence Causing Death, and Other Related Offences Causing DeathREPORTED OR KNOWN VIOLATIONS 2008 2009 2010 2011 2012 % Change from 2011COMBINED DRUGS AND SUBSTANCES ACT 2,379 2,229 2,452 2,629 2,036 -22.6Possession 1770 1717 1933 2037 1555 -23.7Trafficking 509 426 393 471 365 -22.5Importation and Exportation 6 1 1 1 3 200.0Production 94 85 125 117 110 -6.0Drugs - Produce or Traffic Subst 0 0 0 3 3 0.0ROADWAY SAFETY 2008 2009 2010 2011 2012 % Change from 2011CRIMINAL CODE DRIVING 2,344 1,974 1,805 1,687 1,609 -4.6Dangerous Operation 175 138 107 113 115 1.8Flight from Peace Officer 25 33 24 18 26 44.4Impaired Operation/Related Violations 902 931 988 934 895 -4.2Other Criminal Code Driving Violations 1235 856 673 607 564 -7.1Street Racing 7 16 13 15 9 -40.0MOTOR VEHICLE COLLISION – PROPERTY DAMAGE 8,769 7,384 8,394 7,985 8,324 4.2MOTOR VEHICLE COLLISION – INJURY 1,394 1,403 1,556 1,545 1,654 7.1MOTOR VEHICLE COLLISION – FATALITIES * 20 18 30 22 18 -18.2HIGHWAY TRAFFIC ACT OFFENCE NOTICES 42,294 51,795 45,621 44,684 41,078 -8.1Current at February 2013. Includes all reported or known violations recorded in the DRPS RMS. After investigation, a reported violation may be deemedunfounded. *As reported in DRPS TSB Call-Out SheetTraffic Sgt. Shaun Arnott speaks to the mediaand public about driving safely nearconstruction zones.The Regional Municipality of DurhamHeadquarters, located in Whitby, is alsohome to the HQ of the DRPS.Cst. Gillman shops during the holiday CopShopevent that provides gift cards to local kids.18 – Durham Regional Police Service2012 Annual Report – 19