Immigrants in Arizona Fiscal and Economic Impacts
Immigrants in Arizona: Fiscal and Economic Impacts
Immigrants in Arizona: Fiscal and Economic Impacts
- No tags were found...

Create successful ePaper yourself
Turn your PDF publications into a flip-book with our unique Google optimized e-Paper software.
IMMIGRANTS IN ARIZONA<br />
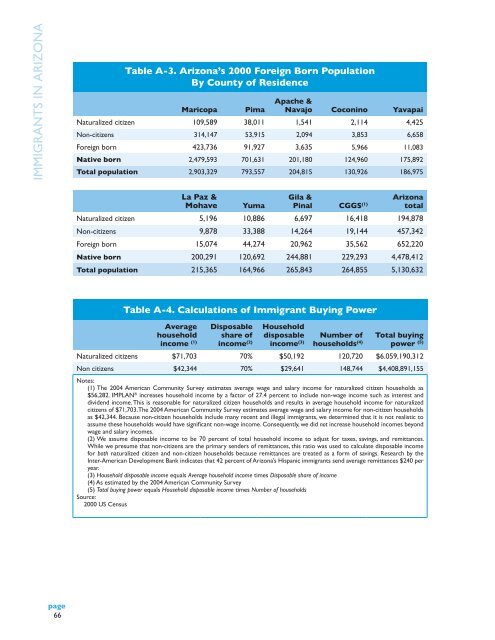
Table A-3. <strong>Arizona</strong>’s 2000 Foreign Born Population<br />
By County of Residence<br />
Maricopa<br />
Pima<br />
Apache &<br />
Navajo Cocon<strong>in</strong>o Yavapai<br />
Naturalized citizen 109,589 38,011 1,541 2,114 4,425<br />
Non-citizens 314,147 53,915 2,094 3,853 6,658<br />
Foreign born 423,736 91,927 3,635 5,966 11,083<br />
Native born 2,479,593 701,631 201,180 124,960 175,892<br />
Total population 2,903,329 793,557 204,815 130,926 186,975<br />
La Paz &<br />
Mohave<br />
Yuma<br />
Gila &<br />
<strong>Arizona</strong><br />
P<strong>in</strong>al CGGS (1) total<br />
Naturalized citizen 5,196 10,886 6,697 16,418 194,878<br />
Non-citizens 9,878 33,388 14,264 19,144 457,342<br />
Foreign born 15,074 44,274 20,962 35,562 652,220<br />
Native born 200,291 120,692 244,881 229,293 4,478,412<br />
Total population 215,365 164,966 265,843 264,855 5,130,632<br />
Table A-4. Calculations of Immigrant Buy<strong>in</strong>g Power<br />
Average<br />
household<br />
<strong>in</strong>come (1)<br />
Disposable<br />
share of<br />
<strong>in</strong>come (2)<br />
Household<br />
disposable<br />
<strong>in</strong>come (3)<br />
Number of<br />
households (4)<br />
Total buy<strong>in</strong>g<br />
power (5)<br />
Naturalized citizens $71,703 70% $50,192 120,720 $6.059,190,312<br />
Non citizens $42,344 70% $29,641 148,744 $4,408,891,155<br />
Notes:<br />
(1) The 2004 American Community Survey estimates average wage <strong>and</strong> salary <strong>in</strong>come for naturalized citizen households as<br />
$56,282. IMPLAN ® <strong>in</strong>creases household <strong>in</strong>come by a factor of 27.4 percent to <strong>in</strong>clude non-wage <strong>in</strong>come such as <strong>in</strong>terest <strong>and</strong><br />
dividend <strong>in</strong>come. This is reasonable for naturalized citizen households <strong>and</strong> results <strong>in</strong> average household <strong>in</strong>come for naturalized<br />
citizens of $71,703. The 2004 American Community Survey estimates average wage <strong>and</strong> salary <strong>in</strong>come for non-citizen households<br />
as $42,344. Because non-citizen households <strong>in</strong>clude many recent <strong>and</strong> illegal immigrants, we determ<strong>in</strong>ed that it is not realistic to<br />
assume these households would have significant non-wage <strong>in</strong>come. Consequently, we did not <strong>in</strong>crease household <strong>in</strong>comes beyond<br />
wage <strong>and</strong> salary <strong>in</strong>comes.<br />
(2) We assume disposable <strong>in</strong>come to be 70 percent of total household <strong>in</strong>come to adjust for taxes, sav<strong>in</strong>gs, <strong>and</strong> remittances.<br />
While we presume that non-citizens are the primary senders of remittances, this ratio was used to calculate disposable <strong>in</strong>come<br />
for both naturalized citizen <strong>and</strong> non-citizen households because remittances are treated as a form of sav<strong>in</strong>gs. Research by the<br />
Inter-American Development Bank <strong>in</strong>dicates that 42 percent of <strong>Arizona</strong>’s Hispanic immigrants send average remittances $240 per<br />
year.<br />
(3) Household disposable <strong>in</strong>come equals Average household <strong>in</strong>come times Disposable share of <strong>in</strong>come<br />
(4) As estimated by the 2004 American Community Survey<br />
(5) Total buy<strong>in</strong>g power equals Household disposable <strong>in</strong>come times Number of households<br />
Source:<br />
2000 US Census<br />
page<br />
66