Casio Computer Co. Ltd
Corporate Report 2009 all pages - Casio
Corporate Report 2009 all pages - Casio
- No tags were found...

Create successful ePaper yourself
Turn your PDF publications into a flip-book with our unique Google optimized e-Paper software.
Environmental Management<br />
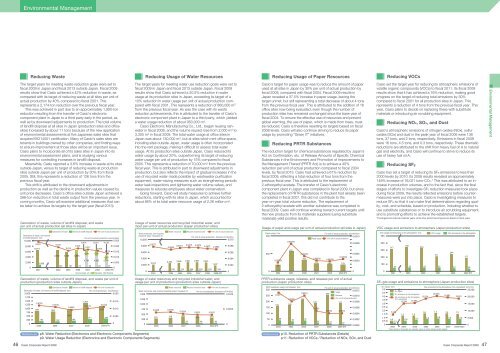
Reducing Waste Reducing Usage of Water Resources Reducing Usage of Paper Resources Reducing VOCs<br />
The target years for meeting waste reduction goals were set to<br />
fiscal 2009 in Japan and fiscal 2013 outside Japan. Fiscal 2009<br />
results show that <strong>Casio</strong> achieved a 42% reduction in waste, as<br />
compared with its target of reducing waste at all sites per unit of<br />
actual production by 40% compared to fiscal 2001. This<br />
represents a 2,174-ton reduction over the previous fiscal year.<br />
This was achieved in part due to an approximately 1,900-ton<br />
reduction resulting from the transfer of <strong>Casio</strong>’s electronic<br />
component plant in Japan to a third party early in the period, as<br />
well as by downward adjustments to production. The total volume<br />
of landfill disposal at all sites in Japan (production sites and office<br />
sites) increased by about 11 tons because of the new application<br />
of environmental assessments at five Japanese sales sites that<br />
acquired ISO14001 certification. Many of <strong>Casio</strong>’s sales sites are<br />
tenants in buildings owned by other companies, and finding ways<br />
to ensure improvement at those sites will be an important issue.<br />
<strong>Casio</strong> plans to incorporate all of its sales sites in Japan into its<br />
environmental assessment plans, and is studying various<br />
measures for controlling increases in landfill disposal.<br />
Meanwhile, <strong>Casio</strong> reported a 3.6% increase in waste at its sites<br />
outside Japan, versus its target of reducing waste at production<br />
sites outside Japan per unit of production by 30% from fiscal<br />
2005. Still, this represents a reduction of 126 tons from the<br />
previous fiscal year.<br />
This shift is attributed to the downward adjustments in<br />
production as well as the decline in production values caused by<br />
unit price decreases. <strong>Casio</strong>’s office sites outside Japan achieved a<br />
266-ton reduction in total waste output from the previous year. In<br />
coming months, <strong>Casio</strong> will examine additional measures that can<br />
be taken to achieve its targets by the target year (fiscal 2013).<br />
Generation of waste, volume of landfill disposal, and waste<br />
per unit of actual production (all sites in Japan)<br />
The target years for meeting water use reduction goals were set to<br />
fiscal 2009 in Japan and fiscal 2013 outside Japan. Fiscal 2009<br />
results show that <strong>Casio</strong> achieved a 20.5% reduction in water<br />
usage at its production sites in Japan, exceeding its target of a<br />
10% reduction in water usage per unit of actual production compared<br />
with fiscal 2001. This represents a reduction of 860,000 m 3<br />
from the previous fiscal year. As was the case with its waste<br />
reduction achievements, this is attributed to the transfer of <strong>Casio</strong>’s<br />
electronic component plant in Japan to a third party, which yielded<br />
a water usage reduction of about 950,000 m 3 .<br />
<strong>Casio</strong> Electronic Manufacturing <strong>Co</strong>., <strong>Ltd</strong>., began reusing rainwater<br />
in fiscal 2008, and the volume reused rose from 2,000 m 3 to<br />
3,300 m 3 in fiscal 2009. The total water usage at office sites in<br />
Japan was about 130,000 m 3 , but at sites which rent office space,<br />
including sites outside Japan, water usage is often incorporated<br />
into the rent package, making it difficult to assess total water<br />
usage. At its production sites outside Japan, <strong>Casio</strong> reduced its<br />
water usage by about 20%, outperforming its target of reducing<br />
water usage per unit of production by 15% compared to fiscal<br />
2005. This represents a reduction of 70,000 m 3 from the previous<br />
fiscal year. This is attributed in part to downward adjustments in<br />
production, but also reflects the impact of gradual increases in the<br />
use of recycled water made possible by wastewater purification<br />
equipment, water-saving measures such as strengthening periodic<br />
water leak inspections and tightening water volume valves, and<br />
measures to educate employees about water conservation.<br />
Going forward, <strong>Casio</strong> will study measures to achieve further<br />
reductions, starting with its sites in Japan, which accounted for<br />
about 86% of its total water resource usage of 2.26 million m 3 .<br />
Usage of water resources and recycled industrial water, and<br />
input per unit of actual production (Japan production sites)<br />
Generation of waste Volume of landfill disposal Per unit of actual production<br />
Water resources Recycled industrial water Per unit of actual production<br />
Water resources, and recycled<br />
Generation of waste, and volume<br />
industrial water: thousand m 3<br />
of landfill disposal: tons<br />
Per unit of actual production: thousand m 3 /¥million<br />
Per unit of actual production: tons/¥million<br />
10,000<br />
0.010<br />
10,000<br />
0.025<br />
6,414 6,312 4,138<br />
0.024 0.019<br />
0.0077<br />
8,000<br />
0.0073 0.0075 0.0074<br />
8,000<br />
0.018<br />
0.020<br />
0.008<br />
0.0068<br />
0.0072 0.0065<br />
0.016<br />
0.017<br />
6,614<br />
0.016<br />
6,000<br />
0.014 0.015<br />
6,000<br />
0.006<br />
1,679 1,920<br />
6,760 5,788 6,695<br />
4,000<br />
1,397 0.010<br />
4,000<br />
0.004<br />
4,735 4,392 2,741<br />
2,490 2,806 2,851 2,827 2,801<br />
2,000<br />
1.089<br />
0.005<br />
2,073<br />
2,000<br />
1,937<br />
103 101 74 29 20 31<br />
0.002<br />
0<br />
0<br />
2001 2004 2005 2006 2007 2008 2009 (FY)<br />
106 174 208 209 185 106<br />
0<br />
0<br />
General waste, etc: [ Valuables Wastes]<br />
2001 2004 2005 2006 2007 2008 2009 (FY)<br />
<strong>Casio</strong>’s target for paper usage was to reduce the amount of paper<br />
used at all sites in Japan by 30% per unit of actual production by<br />
fiscal 2009, compared with fiscal 2004. Fiscal 2009 results in<br />
Japan revealed a 37.5% increase in paper usage, leaving the<br />
target unmet, but still representing a total decrease of about 4 tons<br />
from the previous fiscal year. This is attributed to the addition of 16<br />
office sites now being evaluated, even though the number of<br />
production sites has remained unchanged since the base year of<br />
fiscal 2004. To ensure the effective use of resources and prevent<br />
global warming, the use of paper, which is made from trees, must<br />
be reduced. <strong>Casio</strong> is therefore resetting its targets based on fiscal<br />
2008 levels. <strong>Casio</strong> will also continue striving to reduce its paper<br />
usage by promoting “Green IT” initiatives.<br />
The reduction target for chemical substances regulated by Japan’s<br />
Act on <strong>Co</strong>nfirmation, etc. of Release Amounts of Specific Chemical<br />
Substances in the Environment and Promotion of Improvements to<br />
the Management Thereof (PRTR Act) is to achieve a 40%<br />
reduction per unit of actual production compared to fiscal 2004<br />
levels, by fiscal 2013. <strong>Casio</strong> had achieved a 61% reduction by<br />
fiscal 2009, reflecting a total reduction of four tons from the<br />
previous fiscal year. This is attributed to the replacement of<br />
2-ethoxyethyl acetate. The transfer of <strong>Casio</strong>’s electronic<br />
component plant in Japan was completed in fiscal 2009, but since<br />
the replacement of PRTR substances in the plant had already been<br />
completed in fiscal 2007, this did not contribute to the<br />
year-on-year total volume reduction. The replacement of<br />
2-ethoxyethyl acetate with another substance was completed in<br />
fiscal 2009. <strong>Casio</strong> will continue working toward current targets until<br />
the new products from its materials suppliers (using substitute<br />
materials) yield positive results.<br />
Paper usage: tons<br />
500<br />
250<br />
0<br />
Reducing PRTR Substances<br />
Usage of paper and usage per unit of actual production (all sites in Japan)<br />
0.00025<br />
92<br />
0.00078<br />
278<br />
0.00043<br />
162<br />
Paper usage<br />
0.00030<br />
112<br />
Per unit of actual production: tons/¥million<br />
0.0010<br />
Per unit of actual production<br />
0.00035<br />
0.00028<br />
107 103<br />
2004 2005 2006 2007 2008 2009 (FY)<br />
0.0008<br />
0.0005<br />
0.0003<br />
0<br />
<strong>Casio</strong> set the target year for reducing its atmospheric emissions of<br />
volatile organic compounds (VOCs) to fiscal 2011. Its fiscal 2009<br />
results show that it has achieved a 16% reduction, making good<br />
progress on the target of reducing total emissions by 30%<br />
compared to fiscal 2001 for all production sites in Japan. This<br />
represents a reduction of 4 tons from the previous fiscal year. This<br />
year, <strong>Casio</strong> plans to decide on replacing these with substitute<br />
materials or introducing air scrubbing equipment.<br />
<strong>Casio</strong>’s atmospheric emissions of nitrogen oxides (NOx), sulfur<br />
oxides (SOx) and dust in the peak year of fiscal 2006 were 138<br />
tons, 37 tons, and 2 tons, respectively. Emissions in fiscal 2009<br />
were 16 tons, 4.5 tons, and 0.3 tons, respectively. These dramatic<br />
reductions are attributed to the shift from heavy fuel oil A to natural<br />
gas and electricity, and <strong>Casio</strong> will continue to strive to reduce its<br />
use of heavy fuel oil A.<br />
<strong>Casio</strong> has set a target of reducing its SF6 emissions to less than<br />
2000 levels by 2010. Its 2008 results revealed an approximately<br />
148% increase of 18,021 tons-CO2.* This was attributed to an increase<br />
in production volumes, and to the fact that, since the final<br />
stages of efforts to investigate SF6 reduction measures took place<br />
during fiscal 2009, the results reflected emissions before countermeasures<br />
were put into place. <strong>Casio</strong> is investigating measures to<br />
reduce SF6 so that it can make final determinations regarding quality,<br />
cost, and schedule, based on production, including whether to<br />
use substitute substances or to introduce air scrubbing equipment,<br />
and is promoting efforts to achieve the established targets.<br />
VOC usage and emissions to the atmosphere: tons<br />
500<br />
400<br />
300<br />
200<br />
100<br />
0<br />
Reducing NOx, SOx, and Dust<br />
Reducing SF 6<br />
*The targets here indicate calendar years, while other performance figures are based on fiscal years.<br />
VOC usage and emissions to atmosphere (Japan production sites)<br />
317<br />
342<br />
325<br />
VOC usage<br />
2001 2005 2006 2007 2008 2009 (FY)<br />
211<br />
244<br />
47 52 52 52 43<br />
VOC emissions to the atmosphere<br />
177<br />
39<br />
Environmental Management<br />
Generation of waste, volume of landfill disposal, and waste per unit of<br />
production (production sites outside Japan)<br />
Generation of waste Volume of landfill disposal Per unit of production<br />
Generation of waste, and volume of landfill disposal: tons<br />
Per unit of production: tons/¥million<br />
2,000<br />
0.020<br />
1,750<br />
1,500<br />
1,364<br />
0.015<br />
0.0120<br />
1,250<br />
0.0105<br />
0.0124<br />
0.0110<br />
0.0093<br />
1,000<br />
839<br />
0.010<br />
804<br />
1,238<br />
750<br />
500<br />
994<br />
311 340<br />
0.005<br />
250 164 152 168<br />
0<br />
0<br />
2005 2006 2007 2008 2009 (FY)<br />
References<br />
Water resources Recycled industrial water Per unit of production<br />
Water resources, and recycled industrial water: thousand m 3 Per unit of production: thousand m3/¥million<br />
1,500<br />
0.0100<br />
1,250<br />
1,000<br />
750<br />
500<br />
250<br />
0<br />
0.0039<br />
p8. Water Reduction (Electronics and Electronic <strong>Co</strong>mponents Segments)<br />
p9. Water Usage Reduction (Electronics and Electronic <strong>Co</strong>mponents Segments)<br />
Usage of water resources and recycled industrial water, and<br />
usage per unit of production (production sites outside Japan)<br />
274<br />
0.0040<br />
0.0034<br />
318 368<br />
0.0031 0.0031<br />
384 312<br />
54 46 48<br />
2005 2006 2007 2008 2009 (FY)<br />
0.0050<br />
0<br />
PRTR substance usage, releases, and releases per unit of actual<br />
production (Japan production sites)<br />
PRTR substance usage and releases: tons<br />
300<br />
0.0010<br />
250 0.0011<br />
0.0008 208<br />
200<br />
158 165<br />
150<br />
100<br />
50<br />
0<br />
References<br />
Per unit of actual production: tons/¥million<br />
0.0012<br />
Usage<br />
256<br />
Releases 0.0010<br />
Per unit of actual production<br />
177 0.0008<br />
39<br />
30 37<br />
18 16 12<br />
2004 2005 2006 2007 2008 2009 (FY)<br />
182<br />
0.0005<br />
0.0004 0.0004<br />
0.0006<br />
0.0004<br />
0.0002<br />
0.0000<br />
p10. Reduction of PRTR Substances (Details)<br />
p11. Reduction of VOCs / Reduction of NOx, SOx, and Dust<br />
SF6 gas usage and emissions to atmosphere (Japan production sites)<br />
SF6 inputs: tons<br />
SF6 emissions to the atmosphere (CO2-equivalent): tons-CO2<br />
5.0<br />
25,000<br />
SF6 inputs<br />
4.5<br />
SF6 emissions to the atmosphere<br />
20,446<br />
19,682<br />
4.0<br />
18,714<br />
18,021<br />
SF6 emissions to the atmosphere<br />
20,000<br />
3.5 (CO2-equivalent)<br />
15,248 15,595<br />
3.0<br />
15,000<br />
2.5<br />
2.0<br />
10,000<br />
7,278<br />
1.6 1.7 1.6 1.5<br />
1.5<br />
1.3 1.3<br />
1.0<br />
5,000<br />
0.6<br />
0.6 0.7 0.8 0.9 0.8 0.8<br />
0.5 0.3<br />
0<br />
0<br />
2000 2003 2004 2005 2006 2007 2008 (Year)<br />
*Years shown in this graph are calendar years, to match industry action targets.<br />
46 <strong>Casio</strong> <strong>Co</strong>rporate Report 2009 <strong>Casio</strong> <strong>Co</strong>rporate Report 2009 47