NUTRITIVE VALUE OF RICE POLISH - Journal
NUTRITIVE VALUE OF RICE POLISH - Journal
NUTRITIVE VALUE OF RICE POLISH - Journal

Create successful ePaper yourself
Turn your PDF publications into a flip-book with our unique Google optimized e-Paper software.
© 2011, Scienceline Publication<br />
Online <strong>Journal</strong> of Animal and Feed Research<br />
Volume 2, Issue 3: 235-239 (2012) ISSN 2228-7701<br />
<strong>NUTRITIVE</strong> <strong>VALUE</strong> <strong>OF</strong> <strong>RICE</strong> <strong>POLISH</strong><br />
M.E. HOSSAIN 1* , S. SULTANA 2 , S.M.S. SHAHRIAR 3 and M.M. KHATUN 4<br />
1 Department of Animal Science and Nutrition, Chittagong Veterinary and Animal Sciences University, Chittagong,<br />
Bangladesh<br />
2 UG student, Chittagong Veterinary and Animal Sciences University, Chittagong, Bangladesh<br />
3 Department of Applied Chemistry and Chemical Technology, Chittagong Veterinary and Animal Sciences University,<br />
Chittagong, Bangladesh<br />
4 Veterinary Officer, Strengthening of Support Services for Combating Avian Influenza Project-Bangladesh, District<br />
Livestock Office, Dhaka<br />
*E-mail: emrancvasu@yahoo.com<br />
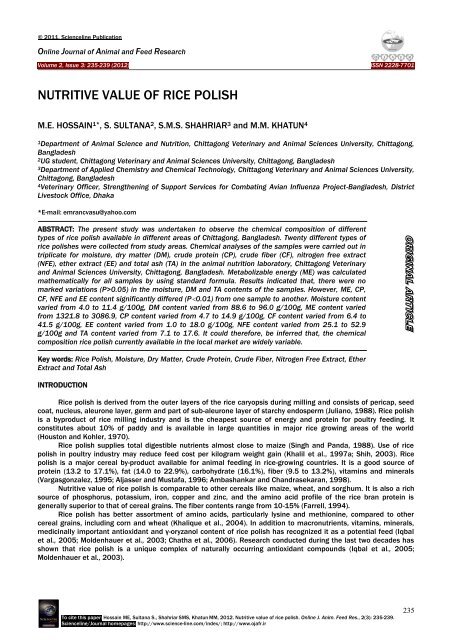
ABSTRACT: The present study was undertaken to observe the chemical composition of different<br />
types of rice polish available in different areas of Chittagong, Bangladesh. Twenty different types of<br />
rice polishes were collected from study areas. Chemical analyses of the samples were carried out in<br />
triplicate for moisture, dry matter (DM), crude protein (CP), crude fiber (CF), nitrogen free extract<br />
(NFE), ether extract (EE) and total ash (TA) in the animal nutrition laboratory, Chittagong Veterinary<br />
and Animal Sciences University, Chittagong, Bangladesh. Metabolizable energy (ME) was calculated<br />
mathematically for all samples by using standard formula. Results indicated that, there were no<br />
marked variations (P>0.05) in the moisture, DM and TA contents of the samples. However, ME, CP,<br />
CF, NFE and EE content significantly differed (P�0.01) from one sample to another. Moisture content<br />
varied from 4.0 to 11.4 g/100g, DM content varied from 88.6 to 96.0 g/100g, ME content varied<br />
from 1321.8 to 3086.9, CP content varied from 4.7 to 14.9 g/100g, CF content varied from 6.4 to<br />
41.5 g/100g, EE content varied from 1.0 to 18.0 g/100g, NFE content varied from 25.1 to 52.9<br />
g/100g and TA content varied from 7.1 to 17.6. It could therefore, be inferred that, the chemical<br />
composition rice polish currently available in the local market are widely variable.<br />
Key words: Rice Polish, Moisture, Dry Matter, Crude Protein, Crude Fiber, Nitrogen Free Extract, Ether<br />
Extract and Total Ash<br />
INTRODUCTION<br />
Rice polish is derived from the outer layers of the rice caryopsis during milling and consists of pericap, seed<br />
coat, nucleus, aleurone layer, germ and part of sub-aleurone layer of starchy endosperm (Juliano, 1988). Rice polish<br />
is a byproduct of rice milling industry and is the cheapest source of energy and protein for poultry feeding. It<br />
constitutes about 10% of paddy and is available in large quantities in major rice growing areas of the world<br />
(Houston and Kohler, 1970).<br />
Rice polish supplies total digestible nutrients almost close to maize (Singh and Panda, 1988). Use of rice<br />
polish in poultry industry may reduce feed cost per kilogram weight gain (Khalil et al., 1997a; Shih, 2003). Rice<br />
polish is a major cereal by-product available for animal feeding in rice-growing countries. It is a good source of<br />
protein (13.2 to 17.1%), fat (14.0 to 22.9%), carbohydrate (16.1%), fiber (9.5 to 13.2%), vitamins and minerals<br />
(Vargasgonzalez, 1995; Aljasser and Mustafa, 1996; Ambashankar and Chandrasekaran, 1998).<br />
Nutritive value of rice polish is comparable to other cereals like maize, wheat, and sorghum. It is also a rich<br />
source of phosphorus, potassium, iron, copper and zinc, and the amino acid profile of the rice bran protein is<br />
generally superior to that of cereal grains. The fiber contents range from 10-15% (Farrell, 1994).<br />
Rice polish has better assortment of amino acids, particularly lysine and methionine, compared to other<br />
cereal grains, including corn and wheat (Khalique et al., 2004). In addition to macronutrients, vitamins, minerals,<br />
medicinally important antioxidant and γ-oryzanol content of rice polish has recognized it as a potential feed (Iqbal<br />
et al., 2005; Moldenhauer et al., 2003; Chatha et al., 2006). Research conducted during the last two decades has<br />
shown that rice polish is a unique complex of naturally occurring antioxidant compounds (Iqbal et al., 2005;<br />
Moldenhauer et al., 2003).<br />
To cite this paper: Hossain ME, Sultana S., Shahriar SMS, Khatun MM, 2012. Nutritive value of rice polish. Online J. Anim. Feed Res., 2(3): 235-239.<br />
Scienceline/<strong>Journal</strong> homepages: http://www.science-line.com/index/; http://www.ojafr.ir<br />
235
Inclusion of rice polish in the diet does not affect the health of chickens (Mahbub et al., 1989). In<br />
experiments with chicks, cereal grains have been replaced with rice polish, and it was found promising in certain<br />
stitutions (Khalil et al., 1997a).<br />
Despite wide range of advantages, the quality of rice polish available in the local market is questioned.<br />
Because, rice husk and saw dusts are frequently incorporated into it to make it cheap. Therefore, the present study<br />
was aimed to investigate the chemical composition of rice polish used as poultry feed available in the local market.<br />
MATERIALS AND METHODS<br />
Study area<br />
Livestock and poultry feeds are mostly available in Pahartali, Khatungonja and Karnaphuli markets of<br />
Chittagong division. Almost all farmers collect their poultry feeds from these markets Therefore, local markets<br />
available in those areas were selected as the study are for collection of sample.<br />
Collection of sample<br />
Samples were collected by using simple random sampling technique. Twenty feed shops were selected<br />
randomly. Approximately 500 grams of rice polish was purchased from each shop. Samples were wrapped up by<br />
polythene bag and preserved in the laboratory for chemical analysis.<br />
Preparation of sample<br />
Samples were subjected to grinder to make it homogenous powder. Later on, it was mixed properly and<br />
exposed to shade to cool down for sampling. Individual samples were identified by marker and subjected to<br />
chemical analyses.<br />
Analysis of sample<br />
Chemical analyses of the samples were carried out in triplicate for moisture, DM, CP, CF, NFE, EE and TA in<br />
the animal nutrition laboratory, Chittagong Veterinary and Animal Sciences University, Chittagong, Bangladesh as<br />
per AOAC (1994).<br />
Calculation of ME<br />
ME was calculated separately for all 20 different rice polish samples. Calculation was performed by<br />
mathematical formula as per Ludhi et al. (1976).<br />
Statistical analysis<br />
Data related to chemical composition of rice polish were compiled by using Microsoft Excel 2007. One<br />
sample t-test was performed to analyze the data by using Stata 11C. For each t-test, reference value for the relative<br />
component was obtained (Banerjee, 1995) to use as the test value for that particular component. Statistical<br />
significance was accepted at 5% level (P�0.05).<br />
RESULTS AND DISCUSSION<br />
Moisture content did not differ significantly (P�0.05). Minimum, maximum and mean values for moisture<br />
content were 4.0, 11.4 and 8.0 respectively. In present study, mean value for moisture in rice polish was 8.0<br />
g/100g. The result is in agreement with Banerjee (1995) who found 8.2 g/100g moisture in rice polish. Malik et al.<br />
(1979) also obtained 7.4 g/100g moisture in rice polish. Other investigators (Anjum et al., 2007; Hamid el al.,<br />
2007; Sharif et al., 2005; Sirikul et al., 2009) also found closely similar results. However, the result of the current<br />
study is contradictory with Rao and Reddy (1986) who found 18.10 g/100g moisture in rice polish.<br />
Similar to moisture, DM content did not differ (P�0.05). Minimum, maximum and mean values for DM<br />
content were 88.6, 96.0 and 92.0 respectively. Mean value for DM in rice polish was 92.0 g/100g. The result is in<br />
agreement with Banerjee (1995) who found 91.8 g/100g DM in rice polish. Malik et al. (1979) also obtained 92.6<br />
g/100g DM in another study. Anjum et al. (2007), Hamid el al. (2007), Sharif et al. (2005) and Sirikul et al. (2009)<br />
also found similar results. However, the result of the current study is inconsistent with Rao and Reddy (1986) who<br />
found 81.9 g/100g DM in rice polish.<br />
Unlike moisture and DM, CP content differed significantly (P�0.01). Minimum, maximum and mean values<br />
for CP content were 4.7, 14.9 and 8.8 respectively. In present study, mean value for CP was 8.8 g/100g. The result<br />
is consistent with other investigators (Anjum et al., 2007; Hamid el al., 2007; Sirikul et al., 2009) also found closely<br />
similar results. However, it differs with Rao and Reddy (1986) who found 12.7 g/100g CP in rice polish. Banerjee<br />
(1995) found 12.0 g/100g CP and Malik et al. (1979) found 11.45 g/100g CP. Similarly, result of the current study<br />
is inconsistent with other investigators (Alencar and Alvarenger, 1991; Gnanasambandam and Hetiarachchy, 1995;<br />
Kahlon and Smith, 2004; Saunder, 1990; Sekhon et al., 1997; Sharif et al., 2005; Sikka, 1990).<br />
Similar to CP, CF content differed significantly (P�0.01). Minimum, maximum and mean values for CF<br />
content were 6.4, 41.5 and 25.2 respectively. In present study, mean value for CF was 25.2 g/100g. The result is<br />
contradictory with Rao and Reddy (1986) who found 7.60 g/100g CF in the rice polish. Similarly Banerjee (1995)<br />
To cite this paper: Hossain ME, Sultana S., Shahriar SMS, Khatun MM, 2012. Nutritive value of rice polish. Online J. Anim. Feed Res., 2(3): 235-239.<br />
Scienceline/<strong>Journal</strong> homepages: http://www.science-line.com/index/; http://www.ojafr.ir<br />
236
also found 11.2 g/100g CF and Malik et al. (1979) found 3.85 g/100g CF in the rice polish. Other researchers<br />
(Gnanasambandam and Hetiarachchy, 1995; Hamid el al., 2007; Saunder, 1990; Sekhon et al., 1997; Sharif et al.,<br />
2005; Sikka, 1990; Kahlon and Smith, 2004) also found similar results.<br />
Table 1 - Chemical composition (g/100g) of individual rice polish<br />
Sample No.<br />
Moist. DM ME<br />
Nutritive value (g/100g)<br />
CP CF NFE EE Ash<br />
1 11.4 88.6 2562.3 14.5 8.0 52.9 5.0 8.2<br />
2 8.0 92.0 1321.8 6.5 36.0 25.5 4.0 20.0<br />
3 9.6 90.4 3071.1 13.3 8.5 47.0 15.0 6.6<br />
4 8.2 91.8 1496.4 6.3 34.5 31.0 4.0 16.0<br />
5 9.4 90.6 3086.9 13.7 6.4 49.4 14.0 7.1<br />
6 7.6 92.4 1353.1 5.6 40.6 25.1 5.0 16.1<br />
7 10 90.0 2524.4 12.8 12.0 46.7 8.0 10.5<br />
8 10.2 89.8 2516.2 11.9 12.8 47.4 8.0 9.8<br />
9 6.8 93.2 1568.9 6.3 33.5 37.7 2.0 13.7<br />
10 5.2 94.8 1886.2 4.7 30.7 44.4 4.0 11.0<br />
11 9 91.0 1518.8 6.1 31.4 38.6 1.0 13.9<br />
12 7.2 92.8 1542.5 6.3 34.6 32.4 4.0 15.5<br />
13 9.2 90.8 2947.8 12.4 9.2 44.2 15.0 10.0<br />
14 4.8 95.2 1649.6 5.3 34.6 32.2 6.0 17.2<br />
15 5.8 94.2 1801.2 5.2 32.8 39.1 5.0 12.1<br />
16 5.4 94.6 1501.3 6.1 36.8 29.1 5.0 17.6<br />
17 4 96.0 1740.2 5.8 41.5 25.4 10.0 13.3<br />
18 8.6 91.4 2969.3 14.9 10.2 35.6 18.0 12.7<br />
19 9.6 90.4 1664.4 6.7 35.8 31.2 6.0 10.7<br />
20 9.6 90.4 3037.5 10.8 11.6 41.8 18.0 8.2<br />
DMDry matter; CPCrude protein, CFCrude fibre, NFENitrogen free extract, EEEther extract<br />
NFE content differed significantly (P�0.01). Minimum, maximum and mean values for NFE content were<br />
25.1, 52.9 and 37.8 respectively. The mean value obtained in present study is in agreement with (Anjum et al.,<br />
2007; Farrel, 1994; Hamid el al., 2007; Kahlon and Smith, 2004; Sharif et al., 2005).<br />
EE content did not differ significantly (P�0.05). Minimum, maximum and mean values for EE content were<br />
1.0, 18.0 and 7.85 respectively. In present study, mean value for EE was 7.85 g/100g. The result is in agreement<br />
with Choo and Sadiq (1982) who found 9.5 g/100g EE in rice polish. Similarly, Hamid el al. (2007) also found 8.7-<br />
18.9 g/100g EE in rice polish. Anjum et al. (2007) also obtained 9.72 g/100g ether EE in rice polish. However, the<br />
result of the current study is contradictory with Banerjee (1995) who found 13.9 g/100g EE in the rice polish. Malik<br />
et al. (1979) found 13.65 g/100g EE in rice polish. Findings of other investigators (Kahlon and Smith, 2004;<br />
Saunder, 1990; Sharif et al., 2005; Sikka, 1990; Sirikul et al., 2009) are also inconsistent with present study.<br />
Table 2 - Mean values for chemical composition (g/100g) of rice polish<br />
Parameters Minimum Maximum Mean SD SE Sig.<br />
Moisture (g/100g) 4.0 11.4 7.98 2.1 0.46 NS<br />
DM (g/100g) 88.6 96.0 92.0 2.1 0.46 NS<br />
ME (kcal/kg) 1321.8 3086.9 2088.0 661.3 147.9 **<br />
CP (g/100g) 4.7 14.9 8.8 3.7 0.83 **<br />
CF (g/100g) 6.4 41.5 25.2 13.2 2.96 **<br />
NFE (g/100g) 25.1 52.9 37.8 8.6 1.93 **<br />
EE (g/100g) 1.0 18.0 7.85 5.3 1.18 **<br />
Ash (g/100g) 7.1 17.6 12.5 3.7 0.84 NS<br />
DM Dry matter; CP Crude protein, CF Crude fibre, NFE Nitrogen free extract, EE Ether extract; SD Standard deviation, SE Standard error; NS Non-significant<br />
(P�0.05); ** Significant at 1% level (P�0.01)<br />
Ash content did not differ significantly (P�0.05). In present study, mean value for Ash was 12.5 g/100g. The<br />
result is in agreement with Banerjee (1995) who found 13.6 g/100g ash in rice polish. Similarly Malik et al. (1979)<br />
obtained 10.80 g/100g ash in rice polish. Other investigators (Anjum et al., 2007; Gnanasambandam and<br />
Hetiarachchy, 1995; Kahlon and Smith, 2004; Saunder, 1990; Sekhon et al., 1997; Sirikul et al., 2009) found<br />
similar results. The result of the current study is contradictory with Rao and Reddy (1986) who found 17.4 g/100g<br />
ash in rice polish. Similarly Ghazi (1992) also who found 17.15 g/100g ash in rice polish. Anjum et al. (2007)<br />
obtained only 5.9 g/100g ash in rice polish.<br />
CONCLUSION<br />
Rice polish is a vital component of the traditional maize soybean based broiler and layer diet. In developing<br />
countries, out of all the crop residues, this is one of the cheapest and largest sources of metabolizable energy as<br />
To cite this paper: Hossain ME, Sultana S., Shahriar SMS, Khatun MM, 2012. Nutritive value of rice polish. Online J. Anim. Feed Res., 2(3): 235-239.<br />
Scienceline/<strong>Journal</strong> homepages: http://www.science-line.com/index/; http://www.ojafr.ir<br />
237
well as crude protein. There is no doubt that, inclusion of rice polish will substantially minimize cost of production<br />
for livestock and poultry. However, current study indicates that the quality of rice polish is widely variable. Therefore,<br />
to formulate least cost balanced ration, rice polish must be analyzed first in the laboratory and then incorporate it<br />
into the practical ration.<br />
REFERENCES<br />
Alencar MC and Alvarenger CBBD (1991). Rice bran-1. Chemicalcomposition and its potential as food.<br />
Arquivos de Biologia Technologia, 34: 95-108.<br />
Aljasser M and Mustafa A (1996). Quality of Hassawi rice bran. Annals of Agricultural Science, 41: 875–880.<br />
Ambashankar K and Chandrasekaran D (1998). Chemical composition and metabolizable energy value of<br />
rice waste for chicken. The Indian Veterinary <strong>Journal</strong>, 75:475–476.<br />
Anjum FM, Pasha I, Bugti MA and Butt MS (2007). Mineral Composition of different rice varieties and their<br />
milling fractions. Pakistan <strong>Journal</strong> of Agricultural Sciences, 44(2): 322-336.<br />
AOAC (2000). Official Methods of Analysis. Association of Official Analytical Chemists. (17 th ed). Gaithersburg,<br />
Maryland, USA.<br />
Banerjee GC (1995). Poultry. (3 rd ed). Mohan Primlani for Oxford & IBH publishing Co. Pvt. Ltd. ISBN: 81-204-<br />
0098-4.<br />
Chatha SAS, Anwar F, Manzoor M and Bajwa JR (2006). Evaluation of antioxidant activity of rice bran extracts<br />
using different antioxidant assays. Grasas Y Aceites, 57:328-335.<br />
Choo BS and Sadiq MM (1982). Indigenous Feed Stuffs and Poultry Feeds. Poultry Production and Research,<br />
anonymous, Sindh, Karachi.<br />
Farrell DJ (1994). Utilization of rice bran in diets for domestic fowl and ducklings. World’s Poultry Science<br />
<strong>Journal</strong>, 5: 116-128.<br />
Ghazi AR (1992). Measurement of true ME (TME) of indigenous feedingstuffs commonly used in poultry<br />
rations. M.Sc. Thesis, University of Agriculture, Faisalabad, Pakistan.<br />
Gnanasambandam R and Hetiarachchy NS (1995). Protein concentrates from unstabilized and and stabilized<br />
rice bran: Preparation and properties. <strong>Journal</strong> of Food Science, 60: 1066-1069.<br />
Hamid AA, Raja Sulaiman RR, Osman A, Saari N (2007). Preliminary study of the chemicalcomposition of<br />
rice milling fractions stabilized by microwave heating. <strong>Journal</strong> of Food Composition and Analysis,<br />
20(7): 627–637.<br />
Houston DF and Kohler GO (1970). Nutritional Proportion of rice. National Academy of Science. Washington,<br />
DC.<br />
Iqbal S, Bhanger MI and Anwar F (2005). Antioxidant properties and components of some commercially<br />
available varieties of rice bran in Pakistan. Food Chemistry, 93: 265-272.<br />
Juliano BO (1988). Rice bran. In “Rice Chemistry and Technology” Ed. Houston DF, Chapter 18: 647-687.<br />
Kahlon TS, Smith GE (2004). Rice bran: a health-promoting ingredient. Cereal Foods World <strong>Journal</strong>, 49(4):<br />
188-194.<br />
Khalil D, Hohler and Henkel H (1997a). Utilization of rice bran and peanut meal in broilers. 1.<br />
Characterization of the feed efficiency of a rice bran/peanut meal diet. Archiv Fur Geflugelkunde.<br />
61:88–94.<br />
Khalique A, Lone KP, Pasha TN and Khan AD (2004). Amino acid digestibility of chemically treated and<br />
extruder cooked defatted rice polishing. Malaysian <strong>Journal</strong> of Nutrition, 10(2): 195-206.<br />
Ludhi GN, Daulat Singh and Ichhponani JS (2009). Variation in nutrient content of feedingstuffs rich in protein<br />
and reassessment of the chemical method for metabolizable energy estimation for poultry. The <strong>Journal</strong><br />
of Agricultural Science, 86(2): 293-303.<br />
Mahbub ASM, Rahman MA and Reza A (1989). Use of rice polish as partial replacement of wheat in the diet<br />
of growing chicks. Bangladesh <strong>Journal</strong> of Animal Science, 18: 99–104.<br />
Malik MY and Chughtai MID (1979). Chemical composition and Nutritive Value of Indigenous Feedstuffs.<br />
Pakistan Association of Advanced Science, pp. 11-45.<br />
Moldenhauer KA, Champagne ET, McCaskill DR and Guraya H (2003). Functional products from rice. In:<br />
Functional Foods. Ed. Mazza G, Technomic Publishing Co., Inc. Lancaster, Base. pp. 71-89.<br />
Rao PV and Reddy MJ (1986). Evaluation of chemical and nutrient composition in raw, de-oiled and parboiled<br />
rice polishing and maize. Indian <strong>Journal</strong> of Poultry Science, 21(1): 72-74.<br />
Saunders R. M., 1990. The properties of rice bran as a foodstuff. Cereal Foods World, 35: 632-636.<br />
Sekhon KS, Dhillon SS, Singh N and Singh B (1997). Functional suitability of commercially milled rice bran in<br />
India for use in different food products. Plant Foods for Human Nutrition, 50: 127-140.<br />
Sharif K, Butt MS and Huma N (2005). Oil extraction from rice industrial waste and its effect on<br />
physicochemical characteristics of cookies. Nutrition and Food Science, 35: 416-427.<br />
Shih FF (2003). An update on the processing of highprotein rice products. Nahrung/Food, 47: 420-424<br />
Sikka SS (1990). Comparative utilisation nutrient in poultry and swine. Ph.D. Dissertation submitted to<br />
Punjab Agricultural University, Ludhiana, India.<br />
Singh KS and Panda B (1988). Poultry Nutrition. (1 st ed). Kalyani Publishers, New Delhi, India. pp. 282-293.<br />
To cite this paper: Hossain ME, Sultana S., Shahriar SMS, Khatun MM, 2012. Nutritive value of rice polish. Online J. Anim. Feed Res., 2(3): 235-239.<br />
Scienceline/<strong>Journal</strong> homepages: http://www.science-line.com/index/; http://www.ojafr.ir<br />
238
Sirikul A, Moongngarm A and Khaengkhan P (2009). Comparison of proximate composition, bioactive<br />
compounds and antioxidant activity of rice bran and defatted rice bran from organic rice and<br />
conventional rice. Asian <strong>Journal</strong> of Food and Agro-Industry, 2(04): 731-743. ISSN 1906-3040.<br />
Vargasgonzalez E (1995). The nutritive value of rice by-products in Costa Rica. Chemical composition,<br />
availability and use. Tropical Animal Nutrition, 2: 31–50.<br />
To cite this paper: Hossain ME, Sultana S., Shahriar SMS, Khatun MM, 2012. Nutritive value of rice polish. Online J. Anim. Feed Res., 2(3): 235-239.<br />
Scienceline/<strong>Journal</strong> homepages: http://www.science-line.com/index/; http://www.ojafr.ir<br />
239