Tree diversity in sacred groves of the Jaintia - DSpace@NEHU ...
Tree diversity in sacred groves of the Jaintia - DSpace@NEHU ...
Tree diversity in sacred groves of the Jaintia - DSpace@NEHU ...

Create successful ePaper yourself
Turn your PDF publications into a flip-book with our unique Google optimized e-Paper software.
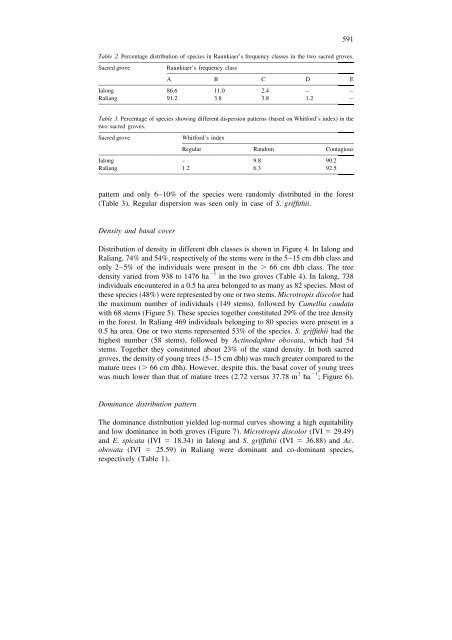
591<br />
Table 2. Percentage distribution <strong>of</strong> species <strong>in</strong> Raunkiaer’s frequency classes <strong>in</strong> <strong>the</strong> two <strong>sacred</strong> <strong>groves</strong>.<br />
Sacred grove Raunkiaer’s frequency class<br />
A B C D E<br />
Ialong 86.6 11.0 2.4 – –<br />
Raliang 91.2 3.8 3.8 1.2 –<br />
Table 3. Percentage <strong>of</strong> species show<strong>in</strong>g different dispersion patterns (based on Whitford’s <strong>in</strong>dex) <strong>in</strong> <strong>the</strong><br />
two <strong>sacred</strong> <strong>groves</strong>.<br />
Sacred grove Whitford’s <strong>in</strong>dex<br />
Regular Random Contagious<br />
Ialong – 9.8 90.2<br />
Raliang 1.2 6.3 92.5<br />
pattern and only 6–10% <strong>of</strong> <strong>the</strong> species were randomly distributed <strong>in</strong> <strong>the</strong> forest<br />
(Table 3). Regular dispersion was seen only <strong>in</strong> case <strong>of</strong> S. griffithii.<br />
Density and basal cover<br />
Distribution <strong>of</strong> density <strong>in</strong> different dbh classes is shown <strong>in</strong> Figure 4. In Ialong and<br />
Raliang, 74% and 54%, respectively <strong>of</strong> <strong>the</strong> stems were <strong>in</strong> <strong>the</strong> 5–15 cm dbh class and<br />
only 2–5% <strong>of</strong> <strong>the</strong> <strong>in</strong>dividuals were present <strong>in</strong> <strong>the</strong> . 66 cm dbh class. The tree<br />
21<br />
density varied from 938 to 1476 ha <strong>in</strong> <strong>the</strong> two <strong>groves</strong> (Table 4). In Ialong, 738<br />
<strong>in</strong>dividuals encountered <strong>in</strong> a 0.5 ha area belonged to as many as 82 species. Most <strong>of</strong><br />
<strong>the</strong>se species (48%) were represented by one or two stems. Microtropis discolor had<br />
<strong>the</strong> maximum number <strong>of</strong> <strong>in</strong>dividuals (149 stems), followed by Camellia caudata<br />
with 68 stems (Figure 5). These species toge<strong>the</strong>r constituted 29% <strong>of</strong> <strong>the</strong> tree density<br />
<strong>in</strong> <strong>the</strong> forest. In Raliang 469 <strong>in</strong>dividuals belong<strong>in</strong>g to 80 species were present <strong>in</strong> a<br />
0.5 ha area. One or two stems represented 53% <strong>of</strong> <strong>the</strong> species. S. griffithii had <strong>the</strong><br />
highest number (58 stems), followed by Act<strong>in</strong>odaphne obovata, which had 54<br />
stems. Toge<strong>the</strong>r <strong>the</strong>y constituted about 23% <strong>of</strong> <strong>the</strong> stand density. In both <strong>sacred</strong><br />
<strong>groves</strong>, <strong>the</strong> density <strong>of</strong> young trees (5–15 cm dbh) was much greater compared to <strong>the</strong><br />
mature trees (. 66 cm dbh). However, despite this, <strong>the</strong> basal cover <strong>of</strong> young trees<br />
2 21<br />
was much lower than that <strong>of</strong> mature trees (2.72 versus 37.78 m ha ; Figure 6).<br />
Dom<strong>in</strong>ance distribution pattern<br />
The dom<strong>in</strong>ance distribution yielded log-normal curves show<strong>in</strong>g a high equitability<br />
and low dom<strong>in</strong>ance <strong>in</strong> both <strong>groves</strong> (Figure 7). Microtropis discolor (IVI 5 29.49)<br />
and E. spicata (IVI 5 18.34) <strong>in</strong> Ialong and S. griffithii (IVI 5 36.88) and Ac.<br />
obovata (IVI 5 25.59) <strong>in</strong> Raliang were dom<strong>in</strong>ant and co-dom<strong>in</strong>ant species,<br />
respectively (Table 1).