

Progress
1st Quarter Report-12/2001 - Quorum
1st Quarter Report-12/2001 - Quorum
- No tags were found...

Create successful ePaper yourself
Turn your PDF publications into a flip-book with our unique Google optimized e-Paper software.
Quorum Information Technologies Inc.<br />
Income Summary<br />
For Q3 FY2005, revenues from operations were $1.01 million compared to $0.91 million for Q3 FY2004, an increase of $0.10 million<br />
or 11%. For the nine months ended September 30, 2005, revenues from operations were $4.35 million compared to $3.13 million for the<br />
nine months ended September 30, 2004, an increase of $1.22 million or 39%.<br />
The net loss from operations (EBITDA) for Q3 FY2005 was $(809,442) or $(0.030) per share compared to $(215,306) or $(0.009) per<br />
share for Q3 FY2004. The net loss from operations (EBITDA) for the nine months ended September 30, 2005 was $(1,573,554) or $(0.058)<br />
per share compared to $(416,324) or $(0.018) per share for the nine months ended September 30, 2004.<br />
The net loss for Q3 FY2005 was $(617,377) or $(0.023) per share, compared to a net loss of $(325,199) or $(0.014) for Q3 FY2004.<br />
The net loss for the nine months ended September 30, 2005 was $(1,217,216) or $(0.045) per share, compared to a net loss of $(518,600)<br />
or $(0.022) for the nine months ended September 30, 2004.<br />
Detailed discussion on Operating Results for the<br />
Periods Ended September 30, 2005 and September 30, 2004<br />
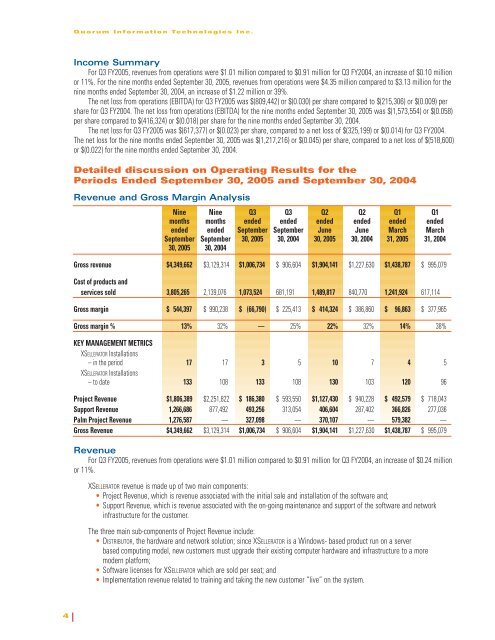
Revenue and Gross Margin Analysis<br />
Nine Nine Q3 Q3 Q2 Q2 Q1 Q1<br />
months months ended ended ended ended ended ended<br />
ended ended September September June June March March<br />
September September 30, 2005 30, 2004 30, 2005 30, 2004 31, 2005 31, 2004<br />
30, 2005 30, 2004<br />
Gross revenue $4,349,662 $3,129,314 $1,006,734 $ 906,604 $1,904,141 $1,227,630 $1,438,787 $ 995,079<br />
Cost of products and<br />
services sold 3,805,265 2,139,076 1,073,524 681,191 1,489,817 840,770 1,241,924 617,114<br />
Gross margin $ 544,397 $ 990,238 $ (66,790) $ 225,413 $ 414,324 $ 386,860 $ 96,863 $ 377,965<br />
Gross margin % 13% 32% — 25% 22% 32% 14% 38%<br />
KEY MANAGEMENT METRICS<br />
XSELLERATOR Installations<br />
– in the period 17 17 3 5 10 7 4 5<br />
XSELLERATOR Installations<br />
– to date 133 108 133 108 130 103 120 96<br />
Project Revenue $1,806,389 $2,251,822 $ 186,380 $ 593,550 $1,127,430 $ 940,228 $ 492,579 $ 718,043<br />
Support Revenue 1,266,686 877,492 493,256 313,054 406,604 287,402 366,826 277,036<br />
Palm Project Revenue 1,276,587 — 327,098 — 370,107 — 579,382 —<br />
Gross Revenue $4,349,662 $3,129,314 $1,006,734 $ 906,604 $1,904,141 $1,227,630 $1,438,787 $ 995,079<br />
Revenue<br />
For Q3 FY2005, revenues from operations were $1.01 million compared to $0.91 million for Q3 FY2004, an increase of $0.24 million<br />
or 11%.<br />
XSELLERATOR revenue is made up of two main components:<br />
• Project Revenue, which is revenue associated with the initial sale and installation of the software and;<br />
• Support Revenue, which is revenue associated with the on-going maintenance and support of the software and network<br />
infrastructure for the customer.<br />
The three main sub-components of Project Revenue include:<br />
• DISTRIBUTOR, the hardware and network solution; since XSELLERATOR is a Windows- based product run on a server<br />
based computing model, new customers must upgrade their existing computer hardware and infrastructure to a more<br />
modern platform;<br />
• Software licenses for XSELLERATOR which are sold per seat; and<br />
• Implementation revenue related to training and taking the new customer “live” on the system.<br />
4