

THE COLOR OF REPRESENTATION
1K1TE7P
1K1TE7P
- No tags were found...

You also want an ePaper? Increase the reach of your titles
YUMPU automatically turns print PDFs into web optimized ePapers that Google loves.
EXECUTIVE SUMMARY<br />
Lack of diversity in local government can have devastating consequences<br />
When elected officials are not as diverse as the community they serve, the voices and interests<br />
of people of color are not adequately considered when decisions are made. National attention<br />
was brought to this problem in Ferguson, Missouri, where the mayor, police chief, municipal<br />
judge, majority of the police force, and 5 of 6 city council members were all white, despite<br />
Ferguson’s population being 67% Black. Such a severe underrepresentation of Ferguson’s Black<br />
community contributed to racially discriminatory policing practices, investigated in the wake<br />
of the killing of unarmed Black teen Michael Brown in August 2014.<br />
Local governments are often understudied, but can have a huge impact on the daily lives of<br />
their citizens, especially communities of color. For example, their decisions can affect whether:<br />
n<br />
n<br />
n<br />
n<br />
n<br />
n<br />
A community is integrated<br />
Public resources are equally distributed throughout the city<br />
Public employees include people of color<br />
Schools disproportionately suspend and expel Black students<br />
Minority owned businesses can thrive<br />
People of color’s right to vote is burdened<br />
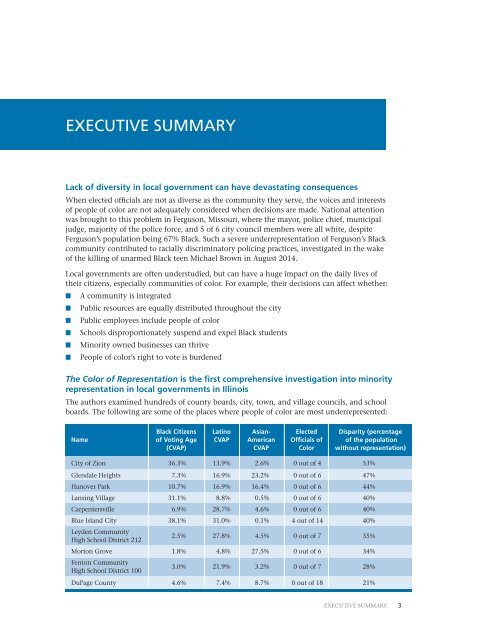
The Color of Representation is the first comprehensive investigation into minority<br />
representation in local governments in Illinois<br />
The authors examined hundreds of county boards, city, town, and village councils, and school<br />
boards. The following are some of the places where people of color are most underrepresented:<br />
Black Citizens Latino Asian- Elected Disparity (percentage<br />
Name of Voting Age CVAP American Officials of of the population<br />
(CVAP) CVAP Color without representation)<br />
City of Zion 36.3% 13.9% 2.6% 0 out of 4 53%<br />
Glendale Heights 7.3% 16.9% 23.2% 0 out of 6 47%<br />
Hanover Park 10.7% 16.9% 16.4% 0 out of 6 44%<br />
Lansing Village 31.1% 8.8% 0.5% 0 out of 6 40%<br />
Carpentersville 6.9% 28.7% 4.6% 0 out of 6 40%<br />
Blue Island City 38.1% 31.0% 0.1% 4 out of 14 40%<br />
Leyden Community<br />
High School District 212<br />
2.5% 27.8% 4.5% 0 out of 7 35%<br />
Morton Grove 1.8% 4.8% 27.5% 0 out of 6 34%<br />
Fenton Community<br />
High School District 100<br />
3.0% 21.9% 3.2% 0 out of 7 28%<br />
DuPage County 4.6% 7.4% 8.7% 0 out of 18 21%<br />
EXECUTIVE SUMMARY 3