seguros y fondos de pensiones informe 2012 - Dirección General de ...
seguros y fondos de pensiones informe 2012 - Dirección General de ...
seguros y fondos de pensiones informe 2012 - Dirección General de ...

You also want an ePaper? Increase the reach of your titles
YUMPU automatically turns print PDFs into web optimized ePapers that Google loves.
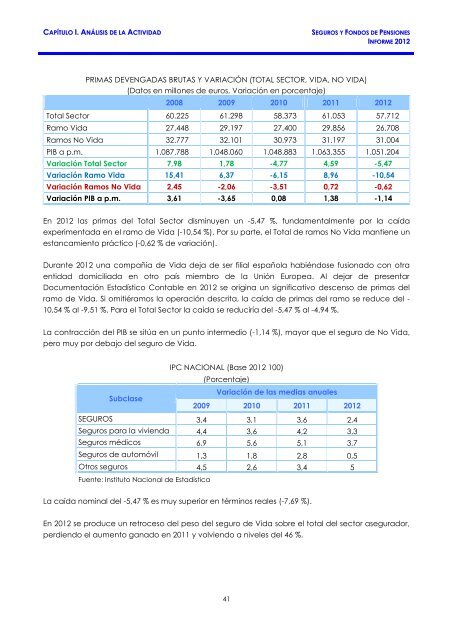
CAPÍTULO I. ANÁLISIS DE LA ACTIVIDAD SEGUROS Y FONDOS DE PENSIONES<br />
INFORME <strong>2012</strong><br />
PRIMAS DEVENGADAS BRUTAS Y VARIACIÓN (TOTAL SECTOR, VIDA, NO VIDA)<br />
(Datos en millones <strong>de</strong> euros, Variación en porcentaje)<br />
2008 2009 2010 2011 <strong>2012</strong><br />
Total Sector 60.225 61.298 58.373 61.053 57.712<br />
Ramo Vida 27.448 29.197 27.400 29.856 26.708<br />
Ramos No Vida 32.777 32.101 30.973 31.197 31.004<br />
PIB a p.m. 1.087.788 1.048.060 1.048.883 1.063.355 1.051.204<br />
Variación Total Sector 7,98 1,78 -4,77 4,59 -5,47<br />
Variación Ramo Vida 15,41 6,37 -6,15 8,96 -10,54<br />
Variación Ramos No Vida 2,45 -2,06 -3,51 0,72 -0,62<br />
Variación PIB a p.m. 3,61 -3,65 0,08 1,38 -1,14<br />
En <strong>2012</strong> las primas <strong>de</strong>l Total Sector disminuyen un -5,47 %, fundamentalmente por la caída<br />
experimentada en el ramo <strong>de</strong> Vida (-10,54 %). Por su parte, el Total <strong>de</strong> ramos No Vida mantiene un<br />
estancamiento práctico (-0,62 % <strong>de</strong> variación).<br />
Durante <strong>2012</strong> una compañía <strong>de</strong> Vida <strong>de</strong>ja <strong>de</strong> ser filial española habiéndose fusionado con otra<br />
entidad domiciliada en otro país miembro <strong>de</strong> la Unión Europea. Al <strong>de</strong>jar <strong>de</strong> presentar<br />
Documentación Estadístico Contable en <strong>2012</strong> se origina un significativo <strong>de</strong>scenso <strong>de</strong> primas <strong>de</strong>l<br />
ramo <strong>de</strong> Vida. Si omitiéramos la operación <strong>de</strong>scrita, la caída <strong>de</strong> primas <strong>de</strong>l ramo se reduce <strong>de</strong>l -<br />
10,54 % al -9,51 %. Para el Total Sector la caída se reduciría <strong>de</strong>l -5,47 % al -4,94 %.<br />
La contracción <strong>de</strong>l PIB se sitúa en un punto intermedio (-1,14 %), mayor que el seguro <strong>de</strong> No Vida,<br />
pero muy por <strong>de</strong>bajo <strong>de</strong>l seguro <strong>de</strong> Vida.<br />
IPC NACIONAL (Base <strong>2012</strong> 100)<br />
(Porcentaje)<br />
Subclase<br />
Variación <strong>de</strong> las medias anuales<br />
2009 2010 2011 <strong>2012</strong><br />
SEGUROS 3,4 3,1 3,6 2,4<br />
Seguros para la vivienda 4,4 3,6 4,2 3,3<br />
Seguros médicos 6,9 5,6 5,1 3,7<br />
Seguros <strong>de</strong> automóvil 1,3 1,8 2,8 0,5<br />
Otros <strong>seguros</strong> 4,5 2,6 3,4 5<br />
Fuente: Instituto Nacional <strong>de</strong> Estadística<br />
La caída nominal <strong>de</strong>l -5,47 % es muy superior en términos reales (-7,69 %).<br />
En <strong>2012</strong> se produce un retroceso <strong>de</strong>l peso <strong>de</strong>l seguro <strong>de</strong> Vida sobre el total <strong>de</strong>l sector asegurador,<br />
perdiendo el aumento ganado en 2011 y volviendo a niveles <strong>de</strong>l 46 %.<br />
41