The state of the UK’s bats 2014
NBMP_Summary_2013_web
NBMP_Summary_2013_web

Create successful ePaper yourself
Turn your PDF publications into a flip-book with our unique Google optimized e-Paper software.
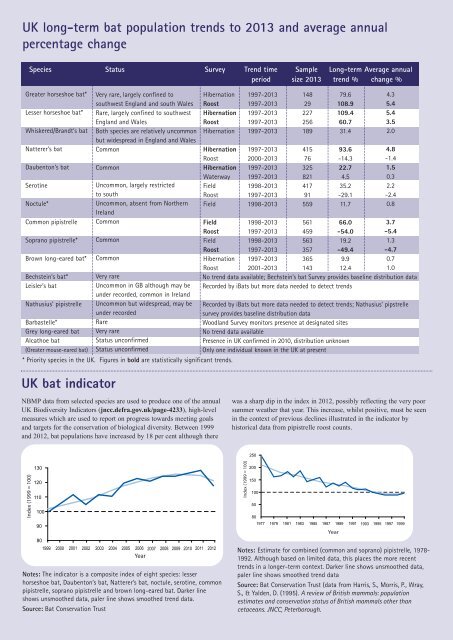
UK long-term bat population trends to 2013 and average annual<br />
percentage change<br />
Species Status Survey Trend time Sample Long-term Average annual<br />
period size 2013 trend % change %<br />
Greater horseshoe bat*<br />
Lesser horseshoe bat*<br />
Whiskered/Brandt’s bat<br />
Natterer’s bat<br />
Daubenton’s bat<br />
Serotine<br />
Noctule*<br />
Common pipistrelle<br />
Soprano pipistrelle*<br />
Brown long-eared bat*<br />
Bechstein’s bat*<br />
Leisler’s bat<br />
Nathusius’ pipistrelle<br />
Barbastelle*<br />
Grey long-eared bat<br />
Alcathoe bat<br />
(Greater mouse-eared bat)<br />
Very rare, largely confined to<br />
southwest England and south Wales<br />
Rare, largely confined to southwest<br />
England and Wales<br />
Both species are relatively uncommon<br />
but widespread in England and Wales<br />
Common<br />
Common<br />
Uncommon, largely restricted<br />
to south<br />
Uncommon, absent from Nor<strong>the</strong>rn<br />
Ireland<br />
Common<br />
Common<br />
Common<br />
Very rare<br />
Uncommon in GB although may be<br />
under recorded, common in Ireland<br />
Uncommon but widespread, may be<br />
under recorded<br />
Rare<br />
Very rare<br />
Status unconfirmed<br />
Status unconfirmed<br />
Hibernation<br />
Roost<br />
Hibernation<br />
Roost<br />
Hibernation<br />
Hibernation<br />
Roost<br />
Hibernation<br />
Waterway<br />
Field<br />
Roost<br />
Field<br />
Field<br />
Roost<br />
Field<br />
Roost<br />
Hibernation<br />
Roost<br />
* Priority species in <strong>the</strong> UK. Figures in bold are statistically significant trends.<br />
1997-2013<br />
1997-2013<br />
1997-2013<br />
1997-2013<br />
1997-2013<br />
1997-2013<br />
2000-2013<br />
1997-2013<br />
1997-2013<br />
1998-2013<br />
1997-2013<br />
1998-2013<br />
1998-2013<br />
1997-2013<br />
1998-2013<br />
1997-2013<br />
1997-2013<br />
2001-2013<br />
148<br />
29<br />
227<br />
256<br />
189<br />
415<br />
76<br />
325<br />
821<br />
417<br />
91<br />
559<br />
561<br />
459<br />
563<br />
357<br />
365<br />
143<br />
79.6<br />
108.9<br />
109.4<br />
60.7<br />
31.4<br />
93.6<br />
-14.3<br />
22.7<br />
4.5<br />
35.2<br />
-29.1<br />
11.7<br />
66.0<br />
-54.0<br />
19.2<br />
-49.4<br />
9.9<br />
12.4<br />
4.3<br />
5.4<br />
5.4<br />
3.5<br />
2.0<br />
4.8<br />
-1.4<br />
1.5<br />
0.3<br />
2.2<br />
-2.4<br />
0.8<br />
3.7<br />
-5.4<br />
1.3<br />
-4.7<br />
0.7<br />
1.0<br />
No trend data available; Bechstein’s bat Survey provides baseline distribution data<br />
Recorded by iBats but more data needed to detect trends<br />
Recorded by iBats but more data needed to detect trends; Nathusius’ pipstrelle<br />
survey provides baseline distribution data<br />
Woodland Survey monitors presence at designated sites<br />
No trend data available<br />
Presence in UK confirmed in 2010, distribution unknown<br />
Only one individual known in <strong>the</strong> UK at present<br />
UK bat indicator<br />
NBMP data from selected species are used to produce one <strong>of</strong> <strong>the</strong> annual<br />
UK Biodiversity Indicators (jncc.defra.gov.uk/page-4233), high-level<br />
measures which are used to report on progress towards meeting goals<br />
and targets for <strong>the</strong> conservation <strong>of</strong> biological diversity. Between 1999<br />
and 2012, bat populations have increased by 18 per cent although <strong>the</strong>re<br />
was a sharp dip in <strong>the</strong> index in 2012, possibly reflecting <strong>the</strong> very poor<br />
summer wea<strong>the</strong>r that year. This increase, whilst positive, must be seen<br />
in <strong>the</strong> context <strong>of</strong> previous declines illustrated in <strong>the</strong> indicator by<br />
historical data from pipistrelle roost counts.<br />
2012<br />
250<br />
Index (1999 = 100)<br />
130<br />
120<br />
110<br />
100<br />
90<br />
80<br />
1999 2000 2001 2002 2003 2004 2005<br />
2006 2007<br />
Year<br />
2008 2009 2010 2011 2012<br />
Notes: <strong>The</strong> indicator is a composite index <strong>of</strong> eight species: lesser<br />
horseshoe bat, Daubenton’s bat, Natterer’s bat, noctule, serotine, common<br />
pipistrelle, soprano pipistrelle and brown long-eared bat. Darker line<br />
shows unsmoo<strong>the</strong>d data, paler line shows smoo<strong>the</strong>d trend data.<br />
Source: Bat Conservation Trust<br />
Index (1999 = 100)<br />
200<br />
150<br />
100<br />
50<br />
80<br />
1977 1979 1981 1983 1985 1987 1989<br />
Year<br />
1991 1993<br />
1995 1997 1999<br />
Notes: Estimate for combined (common and soprano) pipistrelle, 1978-<br />
1992. Although based on limited data, this places <strong>the</strong> more recent<br />
trends in a longer-term context. Darker line shows unsmoo<strong>the</strong>d data,<br />
paler line shows smoo<strong>the</strong>d trend data<br />
Source: Bat Conservation Trust (data from Harris, S., Morris, P., Wray,<br />
S., & Yalden, D. (1995). A review <strong>of</strong> British mammals: population<br />
estimates and conservation status <strong>of</strong> British mammals o<strong>the</strong>r than<br />
cetaceans. JNCC, Peterborough.