

Marking Guidelines for Fire-Injured Trees in California
MARKING GUIDELINES - USDA Forest Service - US Department of ...
MARKING GUIDELINES - USDA Forest Service - US Department of ...
- No tags were found...

You also want an ePaper? Increase the reach of your titles
YUMPU automatically turns print PDFs into web optimized ePapers that Google loves.
Determ<strong>in</strong><strong>in</strong>g what variables to use when mark<strong>in</strong>g trees<br />
Managers need to determ<strong>in</strong>e how much time is available <strong>for</strong> assess<strong>in</strong>g each tree. The most accurate mark<strong>in</strong>g<br />
guidel<strong>in</strong>es (requir<strong>in</strong>g the most time) assess crown <strong>in</strong>jury, cambium <strong>in</strong>jury and red turpent<strong>in</strong>e beetle (RTB)<br />
activity (<strong>for</strong> yellow and sugar p<strong>in</strong>e). At a m<strong>in</strong>imum, a crown <strong>in</strong>jury assessment is required <strong>for</strong> all species.<br />
Assess<strong>in</strong>g cambium <strong>in</strong>jury and/or RTB activity (<strong>for</strong> yellow and sugar p<strong>in</strong>e) requires additional time per tree<br />
but does provide a slight <strong>in</strong>crease <strong>in</strong> accuracy <strong>for</strong> white fir, sugar p<strong>in</strong>e and yellow p<strong>in</strong>e. In general, if<br />
managers choose to only assess crown <strong>in</strong>jury and the fire resulted <strong>in</strong> cambium kill rat<strong>in</strong>gs >2 on most trees,<br />
mortality will be under predicted. The opposite is true if the fire resulted <strong>in</strong> cambium kill rat<strong>in</strong>gs of ≤ 2 on<br />
most trees, as mortality will then be over predicted (this varies by tree species). Mortality could also be<br />
under or over predicted if RTB activity is not assessed (depends of level of post-fire RTB activity).<br />
Knowledge of fire behavior, pre-fire fuel conditions and post-fire RTB activity will help to determ<strong>in</strong>e the<br />
value of assess<strong>in</strong>g <strong>for</strong> these variables.<br />
Select<strong>in</strong>g the predicted probability of mortality (Pm) level that<br />
will meet land management objectives<br />
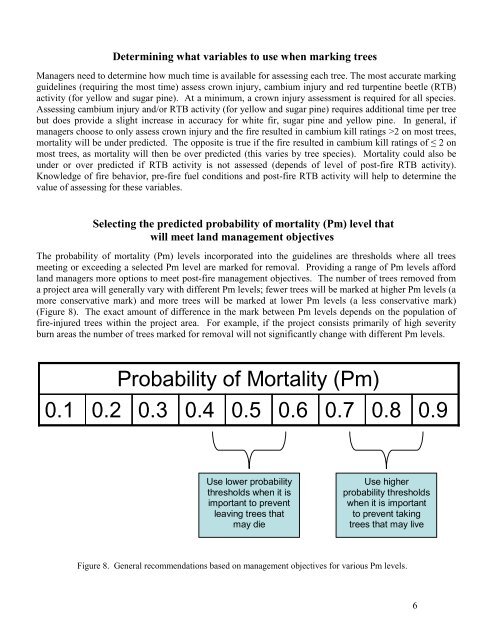
The probability of mortality (Pm) levels <strong>in</strong>corporated <strong>in</strong>to the guidel<strong>in</strong>es are thresholds where all trees<br />
meet<strong>in</strong>g or exceed<strong>in</strong>g a selected Pm level are marked <strong>for</strong> removal. Provid<strong>in</strong>g a range of Pm levels af<strong>for</strong>d<br />
land managers more options to meet post-fire management objectives. The number of trees removed from<br />
a project area will generally vary with different Pm levels; fewer trees will be marked at higher Pm levels (a<br />
more conservative mark) and more trees will be marked at lower Pm levels (a less conservative mark)<br />
(Figure 8). The exact amount of difference <strong>in</strong> the mark between Pm levels depends on the population of<br />
fire-<strong>in</strong>jured trees with<strong>in</strong> the project area. For example, if the project consists primarily of high severity<br />
burn areas the number of trees marked <strong>for</strong> removal will not significantly change with different Pm levels.<br />
0.1<br />
Probability of Mortality (Pm)<br />
0.2 0.3 0.4 0.5 0.6 0.7 0.8<br />
0.9<br />
Use lower probability<br />
thresholds when it is<br />
important to prevent<br />
leav<strong>in</strong>g trees that<br />
may die<br />
Use higher<br />
probability thresholds<br />
when it is important<br />
to prevent tak<strong>in</strong>g<br />
trees that may live<br />
Figure 8. General recommendations based on management objectives <strong>for</strong> various Pm levels.<br />
6