The Earth Scientist
The earTh ScienTiST - NESTA
The earTh ScienTiST - NESTA

You also want an ePaper? Increase the reach of your titles
YUMPU automatically turns print PDFs into web optimized ePapers that Google loves.
Volume XXVII, Issue 1<br />
Page 15<br />
Gumdrop Introduction to GPS<br />
Time<br />
2 – 3, 50-minute periods depending on student comfort level with interpreting graphs.<br />
<strong>The</strong> teaching sequence begins with an explanation of how GPS works and how the motion of GPS<br />
stations, permanently attached to the ground, can be measured on the scale of millimeters per years.<br />
Students interpret GPS data time series plots to determine the motion of different GPS stations.<br />
Lesson Objectives<br />
n Build and use a model of a GPS monument<br />
n<br />
n<br />
n<br />
n<br />
Understand the power of high-precision GPS to monitor movement of <strong>Earth</strong>’s surface<br />
Learn to read and interpret GPS time series plots<br />
Graph the direction and speed of a GPS station’s motion<br />
Visualize deformation of the North American continental margin due to subduction of the<br />
Juan de Fuca plate<br />
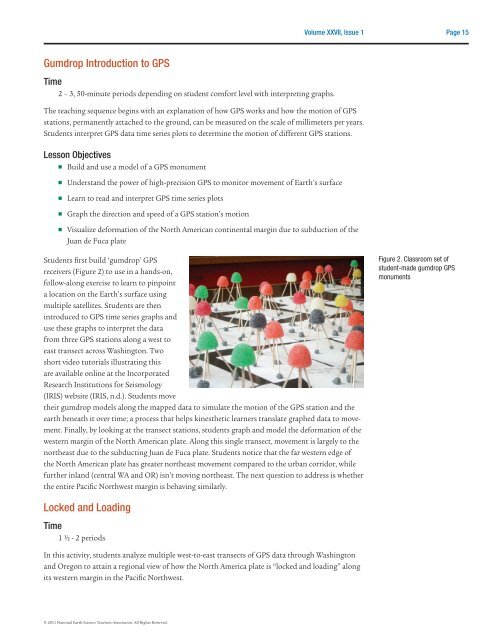
Students first build ‘gumdrop’ GPS<br />
receivers (Figure 2) to use in a hands-on,<br />
follow-along exercise to learn to pinpoint<br />
a location on the <strong>Earth</strong>’s surface using<br />
multiple satellites. Students are then<br />
introduced to GPS time series graphs and<br />
use these graphs to interpret the data<br />
from three GPS stations along a west to<br />
east transect across Washington. Two<br />
short video tutorials illustrating this<br />
are available online at the Incorporated<br />
Research Institutions for Seismology<br />
(IRIS) website (IRIS, n.d.). Students move<br />
their gumdrop models along the mapped data to simulate the motion of the GPS station and the<br />
earth beneath it over time; a process that helps kinesthetic learners translate graphed data to movement.<br />
Finally, by looking at the transect stations, students graph and model the deformation of the<br />
western margin of the North American plate. Along this single transect, movement is largely to the<br />
northeast due to the subducting Juan de Fuca plate. Students notice that the far western edge of<br />
the North American plate has greater northeast movement compared to the urban corridor, while<br />
further inland (central WA and OR) isn’t moving northeast. <strong>The</strong> next question to address is whether<br />
the entire Pacific Northwest margin is behaving similarly.<br />
Figure 2. Classroom set of<br />
student-made gumdrop GPS<br />
monuments<br />
Locked and Loading<br />
Time<br />
1 ½ - 2 periods<br />
In this activity, students analyze multiple west-to-east transects of GPS data through Washington<br />
and Oregon to attain a regional view of how the North America plate is “locked and loading” along<br />
its western margin in the Pacific Northwest.<br />
© 2011 National <strong>Earth</strong> Science Teachers Association. All Rights Reserved.