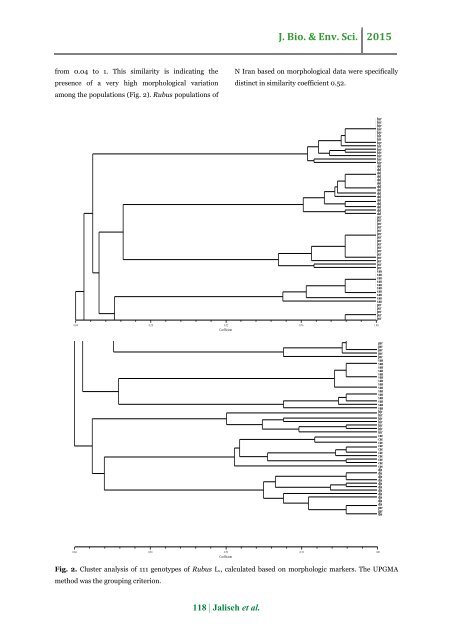
J. Bio. & Env. Sci. 2015 from 0.04 to 1. This similarity is <str<strong>on</strong>g>in</str<strong>on</strong>g>dicat<str<strong>on</strong>g>in</str<strong>on</strong>g>g <str<strong>on</strong>g>the</str<strong>on</strong>g> presence <str<strong>on</strong>g>of</str<strong>on</strong>g> a very high <strong>morphological</strong> variati<strong>on</strong> am<strong>on</strong>g <str<strong>on</strong>g>the</str<strong>on</strong>g> populati<strong>on</strong>s (Fig. 2). <str<strong>on</strong>g>Rubus</str<strong>on</strong>g> populati<strong>on</strong>s <str<strong>on</strong>g>of</str<strong>on</strong>g> N <str<strong>on</strong>g>Iran</str<strong>on</strong>g> <str<strong>on</strong>g>based</str<strong>on</strong>g> <strong>on</strong> <strong>morphological</strong> data were specifically dist<str<strong>on</strong>g>in</str<strong>on</strong>g>ct <str<strong>on</strong>g>in</str<strong>on</strong>g> similarity coefficient 0.52. 0.04 0.28 0.52 0.76 1.00 Coefficient hyr hyr hyr hyr hyr hir hir hyr hir hyr hyr hyr hyr hyr dol dol dol dol dol dol dol dol dol dol dol dol dol dol dol per per per per per per per per per per per per per per per per san san san san san san san san san san per per per per per per per per per per san san san san san san san san san san san san san san san hir hir hir hir hir hir hir cae cae cae cae cae cae cae cae cae cae dis dis dis dis dis dis dis dis dis dis dis per per dis 0.04 0.28 0.52 0.76 1.00 Coefficient Fig. 2. Cluster <strong>analysis</strong> <str<strong>on</strong>g>of</str<strong>on</strong>g> 111 genotypes <str<strong>on</strong>g>of</str<strong>on</strong>g> <str<strong>on</strong>g>Rubus</str<strong>on</strong>g> L., calculated <str<strong>on</strong>g>based</str<strong>on</strong>g> <strong>on</strong> morphologic markers. The UPGMA method was <str<strong>on</strong>g>the</str<strong>on</strong>g> group<str<strong>on</strong>g>in</str<strong>on</strong>g>g criteri<strong>on</strong>. 118 | Jaliseh et al.
J. Bio. & Env. Sci. 2015 Quantitative <strong>morphological</strong> <strong>characters</strong> such as trichome density and shoots sp<str<strong>on</strong>g>in</str<strong>on</strong>g>e, <str<strong>on</strong>g>in</str<strong>on</strong>g>ternode and leaflets length under different climatic c<strong>on</strong>diti<strong>on</strong>s <str<strong>on</strong>g>in</str<strong>on</strong>g> <str<strong>on</strong>g>the</str<strong>on</strong>g> species, especially <str<strong>on</strong>g>in</str<strong>on</strong>g> <str<strong>on</strong>g>the</str<strong>on</strong>g> two species R. Sanctus and R. persicus was variable. The <strong>morphological</strong> <strong>characters</strong> <str<strong>on</strong>g>of</str<strong>on</strong>g> two species because <str<strong>on</strong>g>of</str<strong>on</strong>g> widespread distributi<strong>on</strong> <str<strong>on</strong>g>in</str<strong>on</strong>g> all habitats and climates have changed and <str<strong>on</strong>g>the</str<strong>on</strong>g> populati<strong>on</strong> was grouped accord<str<strong>on</strong>g>in</str<strong>on</strong>g>g to climatic c<strong>on</strong>diti<strong>on</strong>s. Some populati<strong>on</strong> bel<strong>on</strong>g<str<strong>on</strong>g>in</str<strong>on</strong>g>g to two species R. Sanctus and R. persicus located <str<strong>on</strong>g>in</str<strong>on</strong>g> similarity coefficient about 0.15 <str<strong>on</strong>g>in</str<strong>on</strong>g> a cluster. The ma<str<strong>on</strong>g>in</str<strong>on</strong>g> reas<strong>on</strong> for <str<strong>on</strong>g>the</str<strong>on</strong>g> close proximity <str<strong>on</strong>g>of</str<strong>on</strong>g> <str<strong>on</strong>g>the</str<strong>on</strong>g>se two species can be menti<strong>on</strong>ed as follow<str<strong>on</strong>g>in</str<strong>on</strong>g>g: Tax<strong>on</strong> bel<strong>on</strong>g<str<strong>on</strong>g>in</str<strong>on</strong>g>g to two above species has been sampled from a range <str<strong>on</strong>g>of</str<strong>on</strong>g> ecological and climatic area (West Guilan). On <str<strong>on</strong>g>the</str<strong>on</strong>g> o<str<strong>on</strong>g>the</str<strong>on</strong>g>r hand, synchr<strong>on</strong>izati<strong>on</strong> <str<strong>on</strong>g>of</str<strong>on</strong>g> flower<str<strong>on</strong>g>in</str<strong>on</strong>g>g and c<strong>on</strong>sequently <str<strong>on</strong>g>the</str<strong>on</strong>g> poll<str<strong>on</strong>g>in</str<strong>on</strong>g>ati<strong>on</strong> <str<strong>on</strong>g>in</str<strong>on</strong>g> <str<strong>on</strong>g>the</str<strong>on</strong>g> two species can be an <str<strong>on</strong>g>in</str<strong>on</strong>g>creas<str<strong>on</strong>g>in</str<strong>on</strong>g>g factor to occurrence <str<strong>on</strong>g>of</str<strong>on</strong>g> <str<strong>on</strong>g>in</str<strong>on</strong>g>terspecific hybridizati<strong>on</strong>. C<strong>on</strong>sequently, <str<strong>on</strong>g>the</str<strong>on</strong>g> <strong>morphological</strong> structure <str<strong>on</strong>g>of</str<strong>on</strong>g> <str<strong>on</strong>g>the</str<strong>on</strong>g> populati<strong>on</strong> is heterogeneous and <str<strong>on</strong>g>the</str<strong>on</strong>g> populati<strong>on</strong> will develop an <str<strong>on</strong>g>in</str<strong>on</strong>g>terspecific <strong>morphological</strong> <strong>characters</strong>. References Focke WO. 1894. <str<strong>on</strong>g>Rosaceae</str<strong>on</strong>g>. In A. Engler and K. Prantl [eds.], Die naturlichen pflanzenfamilien 3(3), 1–60. Gustafss<strong>on</strong> A. 1942. The orig<str<strong>on</strong>g>in</str<strong>on</strong>g> and properties <str<strong>on</strong>g>of</str<strong>on</strong>g> <str<strong>on</strong>g>the</str<strong>on</strong>g> European blackberry flora. Hereditas 28, 249–277. Hummer KE. 1996. <str<strong>on</strong>g>Rubus</str<strong>on</strong>g> diversity. Horticulture Science 31, 182-183. Iwatsubo Y, Naruhashi N, Weber H. 1995. Chromosome numbers <str<strong>on</strong>g>of</str<strong>on</strong>g> European blackberries (<str<strong>on</strong>g>Rubus</str<strong>on</strong>g> subg. <str<strong>on</strong>g>Rubus</str<strong>on</strong>g>, <str<strong>on</strong>g>Rosaceae</str<strong>on</strong>g>). Plant Systematics and Evoluti<strong>on</strong> 198, 143-149. Joshua S, Caplan, J, Alan Yeakley. 2013. Functi<strong>on</strong>al morphology underlies performance differences am<strong>on</strong>g <str<strong>on</strong>g>in</str<strong>on</strong>g>vasive and n<strong>on</strong>-<str<strong>on</strong>g>in</str<strong>on</strong>g>vasive ruderal <str<strong>on</strong>g>Rubus</str<strong>on</strong>g> species. Oecologia. Kellogg AA, Branaman TJ, J<strong>on</strong>es NM, Little CZ, Swans<strong>on</strong> JD. 2011. Morphological studies <str<strong>on</strong>g>of</str<strong>on</strong>g> develop<str<strong>on</strong>g>in</str<strong>on</strong>g>g <str<strong>on</strong>g>Rubus</str<strong>on</strong>g> prickles suggest that <str<strong>on</strong>g>the</str<strong>on</strong>g>y are modified glandular trichomes. Botany 89, 217-226. Khatamsaze M. 1992. Flora <str<strong>on</strong>g>of</str<strong>on</strong>g> <str<strong>on</strong>g>Iran</str<strong>on</strong>g> (<str<strong>on</strong>g>Rosaceae</str<strong>on</strong>g>). Research <str<strong>on</strong>g>in</str<strong>on</strong>g>stitute <str<strong>on</strong>g>of</str<strong>on</strong>g> forests and ranglands 6, 20-35. Lee J, Dossett M, F<str<strong>on</strong>g>in</str<strong>on</strong>g>n CE. 2012. <str<strong>on</strong>g>Rubus</str<strong>on</strong>g> fruit phenolic research: The good, <str<strong>on</strong>g>the</str<strong>on</strong>g> bad, and <str<strong>on</strong>g>the</str<strong>on</strong>g> c<strong>on</strong>fus<str<strong>on</strong>g>in</str<strong>on</strong>g>g. Food chemistry 130, 785-796. Marulanda M, Lopez AM, Uribe M. 2012. Molecular characterizati<strong>on</strong> <str<strong>on</strong>g>of</str<strong>on</strong>g> <str<strong>on</strong>g>the</str<strong>on</strong>g> Andean blackberry, <str<strong>on</strong>g>Rubus</str<strong>on</strong>g> glaucus, us<str<strong>on</strong>g>in</str<strong>on</strong>g>g SSR markers. Genetic and Molecular Research 11 (1), 322-331. Marulanda ML, López AM, Aguilar SB. 2007. Genetic diversity <str<strong>on</strong>g>of</str<strong>on</strong>g> wild and cultivated <str<strong>on</strong>g>Rubus</str<strong>on</strong>g> species <str<strong>on</strong>g>in</str<strong>on</strong>g> Colombia us<str<strong>on</strong>g>in</str<strong>on</strong>g>g AFLP and SSR markers. Crop Breed<str<strong>on</strong>g>in</str<strong>on</strong>g>g and Applied Biotechnology 7, 242-252. Marulanda ML, López AM, Uribe M. 2010. Genetic diversity and transferability <str<strong>on</strong>g>of</str<strong>on</strong>g> <str<strong>on</strong>g>Rubus</str<strong>on</strong>g> microsatellite markers to South American <str<strong>on</strong>g>Rubus</str<strong>on</strong>g> species. Crop Breed<str<strong>on</strong>g>in</str<strong>on</strong>g>g and Applied Biotechnology 6, 202-212. Raluca RA, Pamfil D, Graham J, Smith K, Balteanu VA, Groza Gh, B<strong>on</strong>drea I, Patrascu B. 2006. Simple sequence repeat SSR markers used <str<strong>on</strong>g>in</str<strong>on</strong>g> <str<strong>on</strong>g>Rubus</str<strong>on</strong>g> species from Romanian flora and North- Europen and north-American <str<strong>on</strong>g>Rubus</str<strong>on</strong>g> cultivars (<str<strong>on</strong>g>Rubus</str<strong>on</strong>g> idaeus). USAMV-CN 63, 252-258. Jolanta P, D<strong>on</strong>atas Z, Juozas L. 2008. Study <str<strong>on</strong>g>of</str<strong>on</strong>g> genetic diversity <str<strong>on</strong>g>in</str<strong>on</strong>g> wild raspberry (<str<strong>on</strong>g>Rubus</str<strong>on</strong>g> idaeus L.) germplasm collecti<strong>on</strong> us<str<strong>on</strong>g>in</str<strong>on</strong>g>g <strong>morphological</strong> <strong>characters</strong> and RAPD markers. Biologija 54 (2), 66–74. Rech<str<strong>on</strong>g>in</str<strong>on</strong>g>ger KH (ed.). 1963-2007. Flora <str<strong>on</strong>g>Iran</str<strong>on</strong>g>ica, No. 66. Akademische Drucku. Verlasanstalt, Graz. 67-74. 119 | Jaliseh et al.