

The Responsibility
TLwEs
TLwEs

You also want an ePaper? Increase the reach of your titles
YUMPU automatically turns print PDFs into web optimized ePapers that Google loves.
FINTECH INVESTMENT<br />
<strong>The</strong> Heat<br />
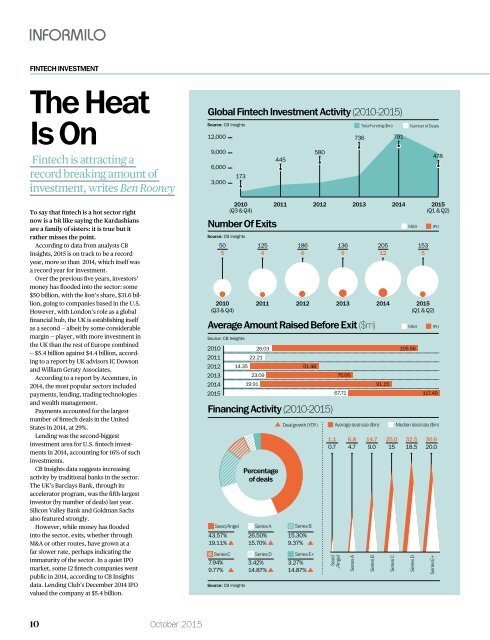
Global Fintech Investment Activity (2010-2015)<br />
Fintech Investment by Region 2010-2015 ($m)<br />
Is On<br />
Source: CB Insights<br />
12,000<br />
Total Funding ($m)<br />
736 791<br />
Number of Deals<br />
Source: IC Dowson and William Geraty Associates<br />
Fintech is attracting a<br />
record breaking amount of<br />
investment, writes Ben Rooney<br />
9,000<br />
6,000<br />
3,000<br />
173<br />
445<br />
580<br />
478<br />
To say that fintech is a hot sector right<br />
now is a bit like saying the Kardashians<br />
are a family of sisters: it is true but it<br />
rather misses the point.<br />
According to data from analysts CB<br />
Insights, 2015 is on track to be a record<br />
year, more so than 2014, which itself was<br />
a record year for investment.<br />
Over the previous five years, investors’<br />
money has flooded into the sector: some<br />
$50 billion, with the lion’s share, $31.6 billion,<br />
going to companies based in the U.S.<br />
However, with London’s role as a global<br />
financial hub, the UK is establishing itself<br />
as a second — albeit by some considerable<br />
margin — player, with more investment in<br />
the UK than the rest of Europe combined<br />
— $5.4 billion against $4.4 billion, according<br />
to a report by UK advisors IC Dowson<br />
and William Geraty Associates.<br />
According to a report by Accenture, in<br />
2014, the most popular sectors included<br />
payments, lending, trading technologies<br />
and wealth management.<br />
Payments accounted for the largest<br />
number of fintech deals in the United<br />
States in 2014, at 29%.<br />
Lending was the second-biggest<br />
investment area for U.S. fintech investments<br />
in 2014, accounting for 16% of such<br />
investments.<br />
CB Insights data suggests increasing<br />
activity by traditional banks in the sector.<br />
<strong>The</strong> UK’s Barclays Bank, through its<br />
accelerator program, was the fifth-largest<br />
investor (by number of deals) last year.<br />
Silicon Valley Bank and Goldman Sachs<br />
also featured strongly.<br />
However, while money has flooded<br />
into the sector, exits, whether through<br />
M&A or other routes, have grown at a<br />
far slower rate, perhaps indicating the<br />
immaturity of the sector. In a quiet IPO<br />
market, some 12 fintech companies went<br />
public in 2014, according to CB Insights<br />
data. Lending Club’s December 2014 IPO<br />
valued the company at $5.4 billion.<br />
Financing Activity (2010-2015)<br />
Seed/Angel<br />
43.57%<br />
19.11%<br />
Series C<br />
7.94%<br />
9.77%<br />
2010<br />
(Q3 & Q4)<br />
Number Of Exits<br />
Source: CB Insights<br />
50<br />
5<br />
2010<br />
(Q3 & Q4)<br />
125<br />
4<br />
Percentage<br />
of deals<br />
Series A<br />
26.50%<br />
15.70%<br />
Series D<br />
3.42%<br />
14.87%<br />
2011 2012 2013 2014 2015<br />
(Q1 & Q2)<br />
186<br />
6<br />
Deal growth (YOY) Average deal size ($m) Median deal size ($m)<br />
Series B<br />
15.30%<br />
9.37%<br />
Series E+<br />
3.27%<br />
14.87%<br />
1.1<br />
0.7<br />
Seed<br />
/Angel<br />
136<br />
9<br />
6.8<br />
4.7<br />
Series A<br />
14.7<br />
9.0<br />
Series B<br />
205<br />
12<br />
25.0<br />
15<br />
Series C<br />
M&A<br />
32.5<br />
18.5<br />
Series D<br />
153<br />
5<br />
2011 2012 2013 2014 2015<br />
(Q1 & Q2)<br />
Average Amount Raised Before Exit ($m)<br />
Source: CB Insights<br />
2010<br />
2011<br />
2012<br />
2013<br />
2014<br />
2015<br />
Source: CB Insights<br />
26.03<br />
22.21<br />
14.35<br />
23.09<br />
19.91<br />
51.48<br />
70.06<br />
67.71<br />
91.15<br />
M&A<br />
105.56<br />
30.6<br />
20.0<br />
Series E+<br />
IPO<br />
IPO<br />
117.49<br />
CANADA<br />
$761<br />
Innotribe Global Fintech Hub Rankings<br />
<strong>The</strong> Innotribe Global Fintech Hub Rankings are an attempt<br />
to rank the hubs around the world using three different<br />
systems and combining them. <strong>The</strong> Global Financial<br />
Centers Index is a ranking of the competitiveness<br />
of financial centers based on over 29,000 financial<br />
New York<br />
1,544<br />
785<br />
64<br />
695<br />
Seoul<br />
1,390<br />
718<br />
58<br />
614<br />
USA<br />
$31,600<br />
SOUTH<br />
AMERICA<br />
$99<br />
UK<br />
$5,400<br />
EUROPE<br />
$4,400<br />
center assessments. <strong>The</strong> aim of the GFCI is to<br />
examine the major financial centers globally in terms of<br />
competitiveness. It is compiled and published twice a<br />
year by Z/Yen Group. <strong>The</strong> SparkLabs Global Ventures<br />
score is compiled by the venture fund of the same name.<br />
London<br />
784<br />
53<br />
683<br />
Singapore<br />
754<br />
40<br />
586<br />
ISRAEL<br />
$453<br />
AFRICA<br />
$329<br />
MIDDLE<br />
EAST<br />
$45<br />
INDIA<br />
$2,200<br />
CHINA<br />
$3,500<br />
Global Financial<br />
Centers Index<br />
San Francisco/Silicon Valley<br />
708<br />
75<br />
655<br />
Chicago<br />
707<br />
40<br />
601<br />
HONG<br />
KONG<br />
$154<br />
SINGAPORE<br />
$167<br />
SparkLabs Global<br />
Ventures Score<br />
1,520 1,438<br />
1,380 1,348<br />
AUSTRALIA/<br />
NZ<br />
$370<br />
SE ASIA<br />
$345<br />
CITIE City<br />
Report<br />
Finally, the CITIE City Report is the product of a<br />
partnership between the UK body Nesta, Accenture<br />
and the Future Cities Catapult. It examines cities<br />
across the world under nine different categories and<br />
scores them.<br />
Source: Z/Yen Group, venturebeat.com, CITIE Report 2015<br />
10 October January 2015 2015<br />
informilo.com 11