

2015 Pathways Annual report
2015 Pathways Annual report
2015 Pathways Annual report

Create successful ePaper yourself
Turn your PDF publications into a flip-book with our unique Google optimized e-Paper software.
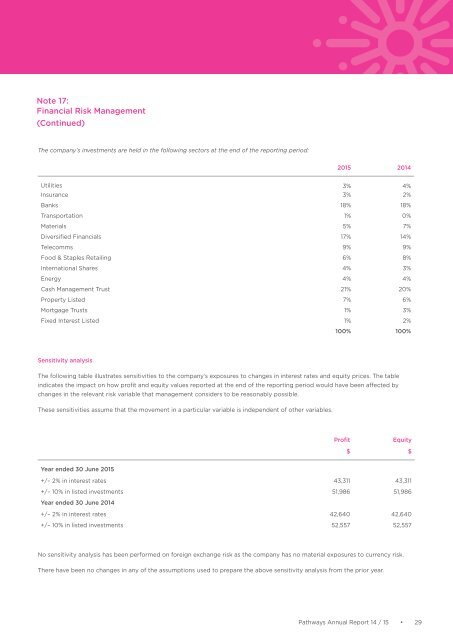
Note 17:<br />
Financial Risk Management<br />
(Continued)<br />
The company’s investments are held in the following sectors at the end of the <strong>report</strong>ing period:<br />
<strong>2015</strong> 2014<br />
Utilities 3% 4%<br />
Insurance 3% 2%<br />
Banks 18% 18%<br />
Transportation 1% 0%<br />
Materials 5% 7%<br />
Diversified Financials 17% 14%<br />
Telecomms 9% 9%<br />
Food & Staples Retailing 6% 8%<br />
International Shares 4% 3%<br />
Energy 4% 4%<br />
Cash Management Trust 21% 20%<br />
Property Listed 7% 6%<br />
Mortgage Trusts 1% 3%<br />
Fixed Interest Listed 1% 2%<br />
100% 100%<br />
Sensitivity analysis<br />
The following table illustrates sensitivities to the company’s exposures to changes in interest rates and equity prices. The table<br />
indicates the impact on how profit and equity values <strong>report</strong>ed at the end of the <strong>report</strong>ing period would have been affected by<br />
changes in the relevant risk variable that management considers to be reasonably possible.<br />
These sensitivities assume that the movement in a particular variable is independent of other variables.<br />
Profit<br />
Equity<br />
$ $<br />
Year ended 30 June <strong>2015</strong><br />
+/– 2% in interest rates 43,311 43,311<br />
+/– 10% in listed investments 51,986 51,986<br />
Year ended 30 June 2014<br />
+/– 2% in interest rates 42,640 42,640<br />
+/– 10% in listed investments 52,557 52,557<br />
No sensitivity analysis has been performed on foreign exchange risk as the company has no material exposures to currency risk.<br />
There have been no changes in any of the assumptions used to prepare the above sensitivity analysis from the prior year.<br />
<strong>Pathways</strong> <strong>Annual</strong> Report 14 / 15 • 29