

DevOps Salary Report
ULKYs
ULKYs

Create successful ePaper yourself
Turn your PDF publications into a flip-book with our unique Google optimized e-Paper software.
The 2015 State of <strong>DevOps</strong> report continues Puppet Labs’ commitment to helping IT<br />
professionals deliver greater value to their organizations. With responses from nearly<br />
5,000 technology professionals around the world, this year’s report delivers new and<br />
updated insights into the value of <strong>DevOps</strong> across industries.<br />
This year’s report shows some continuing key trends. Teams using <strong>DevOps</strong> practices<br />
such as continuous integration and automated testing tend to be high performers, and<br />
IT team performance strongly correlates with organizations’ business performance.<br />
In addition to the higher-level insights included in the report, we have also analyzed<br />
distribution of salaries by job, region, industry, and work practices to provide insight<br />
into workforce trends. This year, we requested more detail about gender and hours<br />
worked, and we segmented Australia and New Zealand into a separate region to more<br />
clearly illustrate geographic differences. (Note that we display detailed results only for<br />
groups with at least 200 respondents.)<br />
Since most respondents are based in the United States, much of our salary analysis<br />
is focused on this region. We also collected valuable data this year comparing women<br />
and men. In order to provide more accurate and meaningful insight around both<br />
geographic and gender demographics, we’d love to get increased participation in<br />
next year’s survey.<br />
We invite you to peruse our findings, see how your own salary stacks up to others<br />
in your region and field, and encourage your colleagues to discuss the findings in<br />
this report.<br />
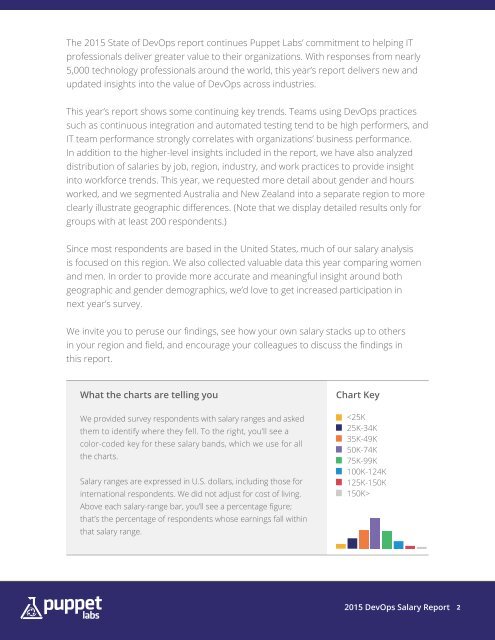
What the charts are telling you<br />
We provided survey respondents with salary ranges and asked<br />
them to identify where they fell. To the right, you’ll see a<br />
color-coded key for these salary bands, which we use for all<br />
the charts.<br />
<strong>Salary</strong> ranges are expressed in U.S. dollars, including those for<br />
international respondents. We did not adjust for cost of living.<br />
Above each salary-range bar, you’ll see a percentage figure;<br />
that’s the percentage of respondents whose earnings fall within<br />
that salary range.<br />
Chart Key<br />
<br />
2015 <strong>DevOps</strong> <strong>Salary</strong> <strong>Report</strong> 2