

AN ENERGY
1SfwbVy
1SfwbVy

Create successful ePaper yourself
Turn your PDF publications into a flip-book with our unique Google optimized e-Paper software.
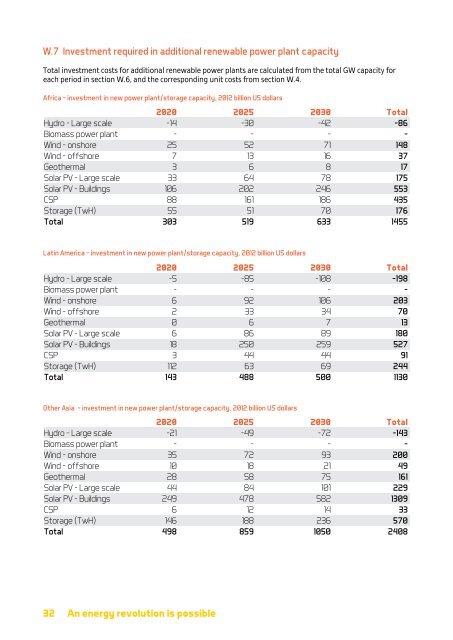
W.7 Investment required in additional renewable power plant capacity<br />
Total investment costs for additional renewable power plants are calculated from the total GW capacity for<br />
each period in section W.6, and the corresponding unit costs from section W.4.<br />
W.8 Final investment costs, 2014 US dollars<br />
Costs are converted to 2014 US dollars using a US inflation multiplier of 1.031, from the US Bureau of Labor<br />
Statistics.<br />
Africa – investment in new power plant/storage capacity, 2012 billion US dollars<br />
Final investment cost results, billion dollars<br />
Hydro - Large scale<br />
Biomass power plant<br />
Wind - onshore<br />
Wind - offshore<br />
Geothermal<br />
Solar PV - Large scale<br />
Solar PV - Buildings<br />
CSP<br />
Storage (TwH)<br />
Total<br />
2020<br />
-14<br />
-<br />
25<br />
7<br />
3<br />
33<br />
106<br />
88<br />
55<br />
303<br />
2025<br />
-30<br />
-<br />
52<br />
13<br />
6<br />
64<br />
202<br />
161<br />
51<br />
519<br />
2030<br />
-42<br />
-<br />
71<br />
16<br />
8<br />
78<br />
246<br />
186<br />
70<br />
633<br />
Total<br />
-86<br />
-<br />
148<br />
37<br />
17<br />
175<br />
553<br />
435<br />
176<br />
1455<br />
Region<br />
Africa<br />
Latin America<br />
Other Asia<br />
Total<br />
2012 US dollars<br />
1455<br />
1130<br />
2408<br />
4993<br />
2014 US dollars<br />
1501<br />
1165<br />
2482<br />
5148<br />
From the 2014 Forbes Billionaires list, the wealthiest 782 individuals or families had a combined wealth of<br />
$5,149 billion. Based on a 2014 population of 7.24 billion, these richest wealth owners represents approximately<br />
0.00001% of humanity. Based on populations from World Energy Outlook 2014, the regional groupings of<br />
Africa, Latin America and Other Asia represent approximately 55% of humanity.<br />
Latin America – investment in new power plant/storage capacity, 2012 billion US dollars<br />
Hydro - Large scale<br />
Biomass power plant<br />
Wind - onshore<br />
Wind - offshore<br />
Geothermal<br />
Solar PV - Large scale<br />
Solar PV - Buildings<br />
CSP<br />
Storage (TwH)<br />
Total<br />
2020<br />
-5<br />
-<br />
6<br />
2<br />
0<br />
6<br />
18<br />
3<br />
112<br />
143<br />
2025<br />
-85<br />
-<br />
92<br />
33<br />
6<br />
86<br />
250<br />
44<br />
63<br />
488<br />
2030<br />
-108<br />
-<br />
106<br />
34<br />
7<br />
89<br />
259<br />
44<br />
69<br />
500<br />
Total<br />
-198<br />
-<br />
203<br />
70<br />
13<br />
180<br />
527<br />
91<br />
244<br />
1130<br />
Investment required in additional renewable power plant capacity<br />
2020<br />
AFRICA<br />
LATIN AMERICA<br />
OTHER ASIA<br />
Wind<br />
Geothermal<br />
Solar PV<br />
CSP<br />
Storage (TWh)<br />
2025<br />
Other Asia – investment in new power plant/storage capacity, 2012 billion US dollars<br />
AFRICA<br />
Hydro - Large scale<br />
Biomass power plant<br />
Wind - onshore<br />
Wind - offshore<br />
Geothermal<br />
Solar PV - Large scale<br />
Solar PV - Buildings<br />
CSP<br />
Storage (TwH)<br />
Total<br />
2020<br />
-21<br />
-<br />
35<br />
10<br />
28<br />
44<br />
249<br />
6<br />
146<br />
498<br />
2025<br />
-49<br />
-<br />
72<br />
18<br />
58<br />
84<br />
478<br />
12<br />
188<br />
859<br />
2030<br />
-72<br />
-<br />
93<br />
21<br />
75<br />
101<br />
582<br />
14<br />
236<br />
1050<br />
Total<br />
-143<br />
-<br />
200<br />
49<br />
161<br />
229<br />
1309<br />
33<br />
570<br />
2408<br />
LATIN AMERICA<br />
OTHER ASIA<br />
2030<br />
AFRICA<br />
LATIN AMERICA<br />
OTHER ASIA<br />
0 100 200 300 400 500 600 700 800 900 1000<br />
Investment in new power plant/storage capacity, 2012 billion US dollars<br />
32 An energy revolution is possible An energy revolution is possible 33