

Shorting Home Equity Mezzanine Tranches
2007_Subprime_Shorting-Home-Equity-Mezzanine-Tranches
2007_Subprime_Shorting-Home-Equity-Mezzanine-Tranches

You also want an ePaper? Increase the reach of your titles
YUMPU automatically turns print PDFs into web optimized ePapers that Google loves.
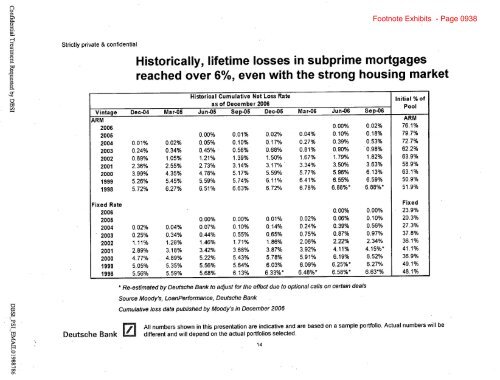
Footnote Exhibits - Page 0938<br />
Strictly private & confidential<br />
Historically, lifetime losses in subprime mortgages<br />
reached over 6%, even with the strong housing market<br />
Historical Cumulative Net Loss Rate<br />
Initial %of<br />
as of December 2006<br />
Pool<br />
Vintage Dec-04 Mar-05 Jun-05 Sep-05 Dec-05 Mar-06 Jun-06 Sep-06<br />
ARM<br />
ARM<br />
2006 0.00% 0.02% 76.1%<br />
2005 0.00% 0.01% 0.02% 0.04% 0.10% 0.18% 79.7%<br />
2004 0.01% 0.02% 0.05% 0.10% 0.17% 0.27% 0.39% 0.53% 72.7%<br />
2003 0.24% 0.34% 0.45% 0.56% 0.68% 0.81% 0.90% 0.98% 62.2%<br />
2002 0.89% 1.05% 1.21% 1.39% 1.50% 1.67% 1.79% 1.82% 63.9%<br />
2001 2.36% 2.55% 2.73% 3.14% 3.17% 3.34% 3.50% 3.63% 58.9%<br />
2000 3.990/ 4.35% 4.78% 5.17% 5.59% 5.77% 5.96% 6.13% 63.1%<br />
1999 5.26% 5.45% 5.59% 5.74% 6.11% 6.41% 6.55% 6.59% 50.9%<br />
1998 5.72% 6.27% 6.51% 6.63% 6.72% 6.78% 6.88%* 6.88%* 51.9%<br />
Fixed Rate<br />
Fixed<br />
2006 0.00% 0.00% 23.9%<br />
2005 0.00% 0.00% 0.01% 0.02% 0.06% 0.10% 20.3%<br />
2004 0.02% 0.04% 0.07% 0.10% 0.14% 0.24% 0.39% 0.56% 27.3%<br />
2003 0.25% 0.34% 0.44% 0.55% 0.65% 0.75% 0.87% 0.97% 37.8%<br />
2002 1.11% 1.28% 1.46% 1.71% 1.86% 2.06% 2.22% 2.34% 36.1%<br />
2001 2.89% 3.18% 3.42% 3.68% 3.87% 3.92% 4.11% 4.15%* 41.1%<br />
2000 4.77% 4.89% 5.22% 5.43% 5.78% 5.91% 6.19% 6.52% 36.9%<br />
1999 5.05% 5.35% 5.56% 5.64% 6.03% 6.09% 6.25%* 6.27% 49.1%<br />
1998 5.56% 5.59% 5.68% 6.13% 6.33%* 6.48%* 6.58%* 6.63*% 48.1%<br />
Re-estimated by Deutsche Bank to adjust for the effect due to optional calls on certain deals<br />
Source Moody's, LoanPerformance, Deutsche Bank<br />
Cumulative loss data published by Moody's in December 2006<br />
Deutsche Banik<br />
D h B k All numbers shown in this presentation are indicative and are based on a sample portfolio. Actual numbers will be<br />
different and will depend on the actual portfolios selected.