PSYCHOLOGY
2bwDGq
2bwDGq

Create successful ePaper yourself
Turn your PDF publications into a flip-book with our unique Google optimized e-Paper software.
Results<br />
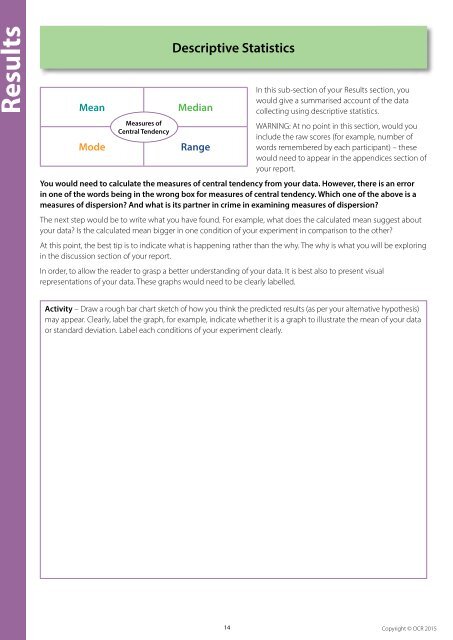
Mean<br />
Mode<br />
Measures of<br />
Central Tendency<br />
Descriptive Statistics<br />
Median<br />
Range<br />
In this sub-section of your Results section, you<br />
would give a summarised account of the data<br />
collecting using descriptive statistics.<br />
WARNING: At no point in this section, would you<br />
include the raw scores (for example, number of<br />
words remembered by each participant) – these<br />
would need to appear in the appendices section of<br />
your report.<br />
You would need to calculate the measures of central tendency from your data. However, there is an error<br />
in one of the words being in the wrong box for measures of central tendency. Which one of the above is a<br />
measures of dispersion? And what is its partner in crime in examining measures of dispersion?<br />
The next step would be to write what you have found. For example, what does the calculated mean suggest about<br />
your data? Is the calculated mean bigger in one condition of your experiment in comparison to the other?<br />
At this point, the best tip is to indicate what is happening rather than the why. The why is what you will be exploring<br />
in the discussion section of your report.<br />
In order, to allow the reader to grasp a better understanding of your data. It is best also to present visual<br />
representations of your data. These graphs would need to be clearly labelled.<br />
Activity – Draw a rough bar chart sketch of how you think the predicted results (as per your alternative hypothesis)<br />
may appear. Clearly, label the graph, for example, indicate whether it is a graph to illustrate the mean of your data<br />
or standard deviation. Label each conditions of your experiment clearly.<br />
14 Copyright © OCR 2015