

UK Cities Culture Report 2015
VuduV
VuduV

You also want an ePaper? Increase the reach of your titles
YUMPU automatically turns print PDFs into web optimized ePapers that Google loves.
<strong>UK</strong> <strong>Cities</strong> <strong>Culture</strong> <strong>Report</strong> <strong>2015</strong><br />
Sheffield 840,700 18,540 0.38<br />
Total employment in <strong>UK</strong> 31,300,000 1,808,000<br />
Given the concentration of creative employment in London, we<br />
are surprised that none of the metropolitan areas in the study<br />
have an LQ of one – although Bristol (at 0.94) and Edinburgh<br />
(0.84) come close. However, if we look at employment in the city<br />
core, rather than the wider local enterprise partnership area or<br />
city region used as the basis of comparison here, we find<br />
evidence of strong clustering: for example in Bristol, Bath and<br />
North Somerset and South Gloucestershire, with an LQ of 1.13,<br />
and Birmingham and Solihull, with an LQ of 0.95.<br />
LQ can signal places where trade between local businesses is<br />
creating a higher ‘multiplier effect’ within the local or regional<br />
economy, and holds out the potential to develop a competitive<br />
advantage for existing and new businesses in that location.<br />
Established creative clusters – e.g. Westminster in London – will<br />
have a higher LQ. So these ‘super clusters’ in the core of other<br />
<strong>UK</strong> cities may be an indicator that the creative economy in these<br />
places is at a tipping point, with critical mass of companies, skills<br />
and capabilities and strong supply chains to enable the sector in<br />
these places to act as a sustainable driver of growth and<br />
employment, less subject to the vicissitudes of national trends.<br />
9.3 Local authority funding<br />
Whilst the <strong>UK</strong>’s nations use different ways to measure public sector<br />
funding of culture, which prevents us from providing directly<br />
comparable data here, there is only one conclusion to be drawn from<br />
the evidence at hand: local authority funding has been falling, and is<br />
going to be cut further. <strong>Cities</strong> have already had to make some tough<br />
calls. The need to preserve statutory services needs to be balanced<br />
against the desire to enhance the culture of the city and its influence<br />
across the growth and development of wealth and opportunity for all<br />
its people. Our evidence suggests that the poorest inner city boroughs<br />
have borne a disproportionate burden in terms of percentage cuts.<br />
The resulting conflict between local government and the cultural<br />
sector, as played out very publicly in cities like Newcastle, can be<br />
damaging in fact and perception. <strong>Cities</strong> who succeed in rethinking of<br />
the role of local government will need to demonstrate their ability to<br />
develop strategies to manage the inevitable decline in direct funding,<br />
and to act as an enabler in its replacement with other kinds of support.<br />
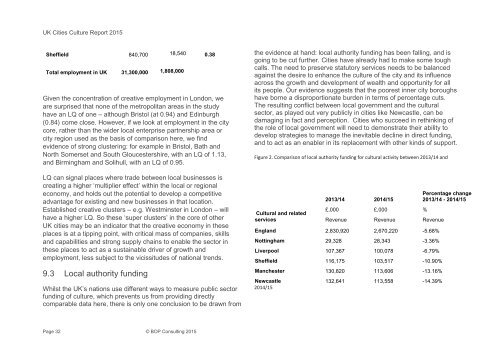
Figure 2. Comparison of local authority funding for cultural activity between 2013/14 and<br />
Cultural and related<br />
services<br />
2013/14 2014/15<br />
£,000 £,000 %<br />
Revenue Revenue Revenue<br />
England 2,830,920 2,670,220 -5.68%<br />
Nottingham 29,328 28,343 -3.36%<br />
Liverpool 107,367 100,078 -6.79%<br />
Sheffield 116,175 103,517 -10.90%<br />
Manchester 130,820 113,606 -13.16%<br />
Newcastle 132,641 113,558 -14.39%<br />
2014/15<br />
Percentage change<br />
2013/14 - 2014/15<br />
Page 32 © BOP Consulting <strong>2015</strong>