

A Just Chicago
A_Just_Chicago
A_Just_Chicago

Create successful ePaper yourself
Turn your PDF publications into a flip-book with our unique Google optimized e-Paper software.
There is an alternative<br />
to spending hundreds<br />
of millions of dollars<br />
implementing “education<br />
reforms” that enrich<br />
investors with lucrative<br />
contracts for online<br />
programs, textbooks,<br />
educational software and<br />
hardware, and push high<br />
test scores as a goal.<br />
learning from places like museums, parks, theaters,<br />
and from travelling. They also spend about<br />
400 hours more in literacy activities (Tavernise,<br />
2012, February).<br />
Parental income is not destiny. Within each<br />
category, there is tremendous variation. Some<br />
wealthy students are unsuccessful and some<br />
poor students do well. However, in general, higher<br />
parental income corresponds to higher ACT<br />
scores. There is an alternative to spending hundreds<br />
of millions of dollars implementing “education<br />
reforms” that enrich investors with lucrative<br />
contracts for online programs, textbooks,<br />
educational software and hardware, and push<br />
high test scores as a goal. These approaches<br />
have little positive impact on actual educational<br />
outcomes. Instead, <strong>Chicago</strong> should promote<br />
higher wages and full employment.<br />
Results of Milwaukee’s 1994-1998 New<br />
Hope Project indicates that an emphasis on<br />
economic improvements would benefit children<br />
academically (Miller, Huston, Duncan, McLoyd<br />
& Weisner, 2008). Project administrators randomly<br />
assigned qualified parents to either an<br />
experimental or control group. The experimental<br />
group’s participants received jobs, money to<br />
supplement below-poverty wages, health insurance,<br />
and child care subsidies. Compared to the<br />
control group, which received none of these supports,<br />
children of project participants had better<br />
academic performance, were more engaged in<br />
school, received better grades, and were less<br />
likely to have to repeat a grade.<br />
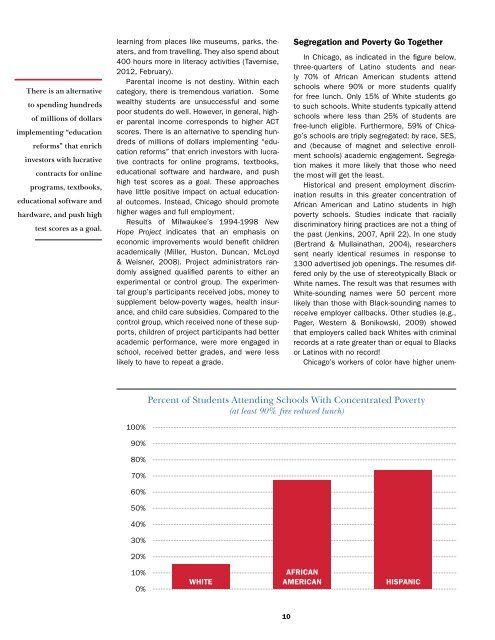
Segregation and Poverty Go Together<br />
In <strong>Chicago</strong>, as indicated in the figure below,<br />
three-quarters of Latino students and nearly<br />
70% of African American students attend<br />
schools where 90% or more students qualify<br />
for free lunch. Only 15% of White students go<br />
to such schools. White students typically attend<br />
schools where less than 25% of students are<br />
free-lunch eligible. Furthermore, 59% of <strong>Chicago</strong>’s<br />
schools are triply segregated: by race, SES,<br />
and (because of magnet and selective enrollment<br />
schools) academic engagement. Segregation<br />
makes it more likely that those who need<br />
the most will get the least.<br />
Historical and present employment discrimination<br />
results in this greater concentration of<br />
African American and Latino students in high<br />
poverty schools. Studies indicate that racially<br />
discriminatory hiring practices are not a thing of<br />
the past (Jenkins, 2007, April 22). In one study<br />
(Bertrand & Mullainathan, 2004), researchers<br />
sent nearly identical resumes in response to<br />
1300 advertised job openings. The resumes differed<br />
only by the use of stereotypically Black or<br />
White names. The result was that resumes with<br />
White-sounding names were 50 percent more<br />
likely than those with Black-sounding names to<br />
receive employer callbacks. Other studies (e.g.,<br />
Pager, Western & Bonikowski, 2009) showed<br />
that employers called back Whites with criminal<br />
records at a rate greater than or equal to Blacks<br />
or Latinos with no record!<br />
<strong>Chicago</strong>’s workers of color have higher unem-<br />
Percent of Students Attending Schools With Concentrated Poverty<br />
(at least 90% free reduced lunch)<br />
100%<br />
90%<br />
80%<br />
70%<br />
60%<br />
50%<br />
40%<br />
30%<br />
20%<br />
10%<br />
0%<br />
WHITE<br />
AFRICAN<br />
AMERICAN<br />
HISPANIC<br />
10