

isla
6YImNOtrh
6YImNOtrh

You also want an ePaper? Increase the reach of your titles
YUMPU automatically turns print PDFs into web optimized ePapers that Google loves.
National Overview<br />
Number (n)<br />
120<br />
100<br />
80<br />
60<br />
40<br />
20<br />
89<br />
No COD Listed<br />
95 98<br />
COD Listed<br />
89<br />
89<br />
85<br />
69<br />
113<br />
118<br />
83<br />
102<br />
0.6<br />
0.5<br />
0.4<br />
0.3<br />
0.2<br />
0.1<br />
Rate (per 100,000 pop.)<br />
Number (n)<br />
40<br />
35<br />
30<br />
25<br />
20<br />
15<br />
10<br />
5<br />
Crude Drowning Rate per 100,000<br />
Crude Drowning Deaths (n)<br />
0.8<br />
0.7<br />
0.6<br />
0.5<br />
0.4<br />
0.3<br />
0.2<br />
0.1<br />
Rate (per 100,000 pop.)<br />
0<br />
2004-05<br />
2005-06<br />
2006-07<br />
2007-08<br />
2008-09<br />
2009-10<br />
2010-11<br />
2011-12<br />
2012-13<br />
2013-14<br />
2014-15<br />
0<br />
0<br />
NSW<br />
QLD<br />
VIC<br />
WA<br />
SA<br />
TAS<br />
NT<br />
0.0<br />
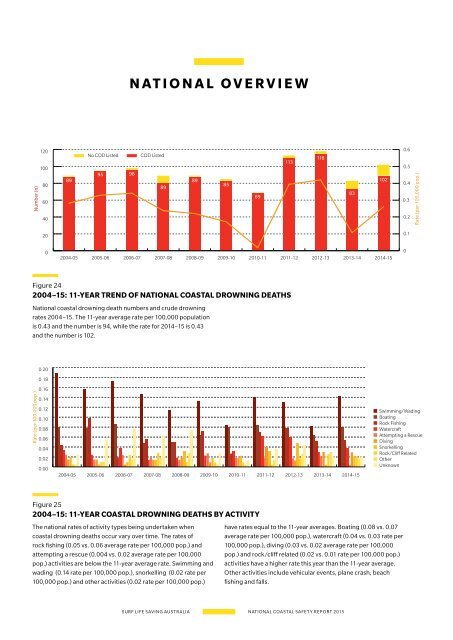
Figure 24<br />
2004–15: 11-year Trend of National Coastal Drowning Deaths<br />
National coastal drowning death numbers and crude drowning<br />
rates 2004–15. The 11-year average rate per 100,000 population<br />
is 0.43 and the number is 94, while the rate for 2014–15 is 0.43<br />
and the number is 102.<br />
Figure 26<br />
2014–15: Coastal drowning deaths by state<br />
Of the 102 coastal drowning deaths, 37 (36%) occurred in NSW,<br />
19 (19%) in Qld, 18 (18%) in Vic, 14 (14%) in WA, 12 (12%) in SA,<br />
2 (2%) in Tas, and zero in NT.<br />
Rate (per 100,000 pop.)<br />
0.20<br />
0.18<br />
0.16<br />
0.14<br />
0.12<br />
0.10<br />
0.08<br />
0.06<br />
0.04<br />
0.02<br />
0.00<br />
2004-05<br />
2005-06<br />
2006-07<br />
2007-08<br />
2008-09<br />
2009-10<br />
2010-11<br />
2011-12<br />
2012-13<br />
2013-14<br />
2014-15<br />
Swimming/Wading<br />
Boating<br />
Rock Fishing<br />
Watercraft<br />
Attempting a Rescue<br />
Diving<br />
Snorkelling<br />
Rock/Cliff Related<br />
Other<br />
Unknown<br />
Number (n)<br />
16<br />
14<br />
12<br />
10<br />
8<br />
6<br />
4<br />
2<br />
0<br />
0-4<br />
5-9<br />
Female<br />
Male<br />
10-14<br />
15-19<br />
20-24<br />
25-29<br />
30-34<br />
35-39<br />
40-44<br />
45-49<br />
50-54<br />
55-59<br />
60-64<br />
65-69<br />
70-74<br />
75-79<br />
80-84<br />
85+<br />
unknown<br />
0.08<br />
0.07<br />
0.06<br />
0.05<br />
0.04<br />
0.03<br />
0.02<br />
0.01<br />
0<br />
Rate (per 100,000 pop.)<br />
Figure 25<br />
2004–15: 11-year Coastal Drowning Deaths by Activity<br />
The national rates of activity types being undertaken when<br />
coastal drowning deaths occur vary over time. The rates of<br />
rock fishing (0.05 vs. 0.06 average rate per 100,000 pop.) and<br />
attempting a rescue (0.004 vs. 0.02 average rate per 100,000<br />
pop.) activities are below the 11-year average rate. Swimming and<br />
wading (0.14 rate per 100,000 pop.), snorkelling (0.02 rate per<br />
100,000 pop.) and other activities (0.02 rate per 100,000 pop.)<br />
have rates equal to the 11-year averages. Boating (0.08 vs. 0.07<br />
average rate per 100,000 pop.), watercraft (0.04 vs. 0.03 rate per<br />
100,000 pop.), diving (0.03 vs. 0.02 average rate per 100,000<br />
pop.) and rock/cliff related (0.02 vs. 0.01 rate per 100,000 pop.)<br />
activities have a higher rate this year than the 11-year average.<br />
Other activities include vehicular events, plane crash, beach<br />
fishing and falls.<br />
Figure 27<br />
2014–15: Coastal Drowning Deaths by Age Group and Sex<br />
The age group representing the highest rate of fatalities is 45–49<br />
years (n=15, 0.06 rate per 100,000 pop.). Eighty-eight fatalities<br />
(86%) were male.<br />
Surf life saving Australia National Coastal safety report 2015 Section Two Drowning Analysis