RCM: A new model accounting for the non-linear ... - Jos Brouwers
RCM: A new model accounting for the non-linear ... - Jos Brouwers
RCM: A new model accounting for the non-linear ... - Jos Brouwers

Create successful ePaper yourself
Turn your PDF publications into a flip-book with our unique Google optimized e-Paper software.
302 P. Spiesz et al. / Construction and Building Materials 27 (2012) 293–304<br />
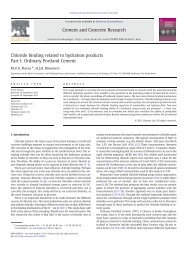
Fig. 9. Optimized total chloride concentration profiles, concrete C2 (Table 1): (a) 6 h; (b) 9 h; (c) 18 h.<br />
Fig. 10. Optimized total chloride concentration profiles, concretes C3, C4 and C5 (Table 1): (a) C3; (b) C4; (c) C5.<br />
concentration measured <strong>for</strong> each analyzed profile. The initial<br />
solutions were selected in <strong>the</strong>ir expected orders of magnitude, as<br />
follows: Deff =1 10 12 m 2 /s, k =1 10 6 1/s, n = 0.5 and<br />
K b = 0.5 10 3 dm 3n /g n . Finally, <strong>the</strong> total mean square error of<br />
<strong>the</strong> relative difference between <strong>the</strong> experimental and simulated total<br />
chloride concentration profiles was minimized by adjusting <strong>the</strong><br />
values of k, Kb, n and Deff. The optimized values of <strong>the</strong> parameters<br />
and simulated chloride profiles are shown respectively in Table 3<br />
and Figs. 8–10.<br />
When analyzing <strong>the</strong> binding coefficients K b and n it can be noticed<br />
that <strong>the</strong> values obtained from <strong>the</strong> numerical <strong>model</strong> (Table 3)<br />
are in a good agreement with <strong>the</strong> values presented in Table 2, measured<br />
by speciation tests. The binding capacity Kb, which determines<br />
<strong>the</strong> maximum amount of bound-chlorides, as expected<br />
from Table 2, is found to be larger <strong>for</strong> concrete containing Cem<br />
T10 (C1, C2) than <strong>for</strong> concrete with Cem I (C3, C4 and C5). This is<br />
due to an increased C3A content in Cem T10; <strong>the</strong> hydration products<br />
of this cement phase are capable of binding more chlorides.<br />
When comparing <strong>the</strong> values of <strong>the</strong> optimized Kb to <strong>the</strong> experimental<br />
data presented in Table 2, it can be seen that <strong>the</strong> values optimized<br />
<strong>for</strong> concrete are about five times lower than obtained on<br />
<strong>the</strong> pastes of similar cements. These values were expected because<br />
<strong>the</strong> volume of <strong>the</strong> paste in concrete is about 1/5, and only <strong>the</strong> paste<br />
can bind chlorides.<br />
The optimum value of n, describing <strong>the</strong> intensity of binding and<br />
<strong>the</strong> maximum amount of bound-chlorides, is found to be in <strong>the</strong><br />
range of 0.48–0.55, which is also in agreement with sorption data<br />
presented in Table 2.<br />
In <strong>non</strong>e of <strong>the</strong> analyzed chloride concentration profiles <strong>the</strong> maximum<br />
total chloride concentration was achieved except <strong>for</strong> <strong>the</strong> surface<br />
layer of concrete, where <strong>the</strong> chloride bearing solution and<br />
concrete are in contact from <strong>the</strong> start of <strong>the</strong> test. This confirms that<br />
<strong>the</strong> assumption of <strong>non</strong>-equilibrium in <strong>the</strong> chloride transport <strong>model</strong><br />
Fig. 11. Simulated chloride concentration profiles, concrete C2, 6 h (Table 1).<br />
presented in this paper is correct. In order to account <strong>for</strong> this phenome<strong>non</strong>,<br />
k, <strong>the</strong> mass transfer coefficient, is introduced (see Section<br />
5.1). The optimized values of k decrease during <strong>the</strong><br />
migration process, which can be observed in Table 3. One can find<br />
in Figs. 8 and 9 that <strong>the</strong> value of k plays a deciding role on <strong>the</strong><br />
shape of each profile. When <strong>the</strong> chloride mass transfer coefficient<br />
is larger, chlorides are bound faster and <strong>the</strong>y do not have so much<br />
freedom to penetrate far<strong>the</strong>r into <strong>the</strong> concrete, which results in a<br />
more abrupt chloride profile (e.g. see in Fig. 8a). However, when<br />
<strong>the</strong> value of k becomes smaller, <strong>the</strong> mass transfer rate of chlorides<br />
becomes <strong>the</strong> limiting factor and <strong>the</strong> profile is characterized by a