Global Neurostimulation Devices Market Anlysis by P&S Market Research
Based on type of devices, the implantable/internal devices segment is expected to witness the fastest growth during the forecast period. Among the various applications, the pain management segment accounted for the largest share in the global market in 2014; and the segment is expected to witness the fastest growth, with 13.5% CAGR during the 2015 – 2020.
Based on type of devices, the implantable/internal devices segment is expected to witness the fastest growth during the forecast period. Among the various applications, the pain management segment accounted for the largest share in the global market in 2014; and the segment is expected to witness the fastest growth, with 13.5% CAGR during the 2015 – 2020.
You also want an ePaper? Increase the reach of your titles
YUMPU automatically turns print PDFs into web optimized ePapers that Google loves.
<strong>Global</strong> <strong>Neurostimulation</strong> <strong>Devices</strong> <strong>Market</strong> is Expected to Grow with 13% CAGR<br />
during 2015 – 2020<br />
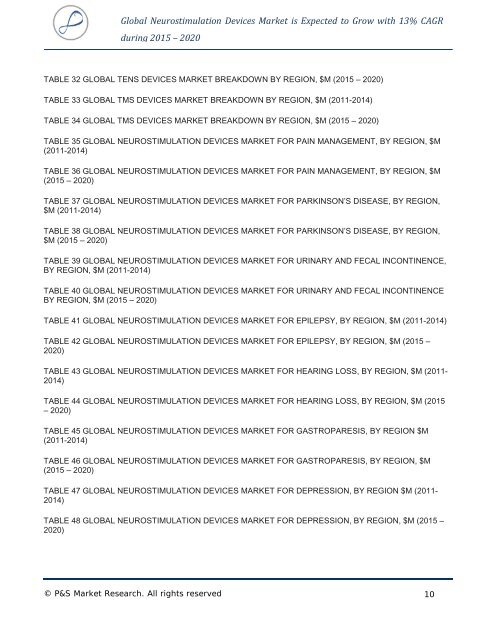
TABLE 32 GLOBAL TENS DEVICES MARKET BREAKDOWN BY REGION, $M (2015 – 2020)<br />
TABLE 33 GLOBAL TMS DEVICES MARKET BREAKDOWN BY REGION, $M (2011-2014)<br />
TABLE 34 GLOBAL TMS DEVICES MARKET BREAKDOWN BY REGION, $M (2015 – 2020)<br />
TABLE 35 GLOBAL NEUROSTIMULATION DEVICES MARKET FOR PAIN MANAGEMENT, BY REGION, $M<br />
(2011-2014)<br />
TABLE 36 GLOBAL NEUROSTIMULATION DEVICES MARKET FOR PAIN MANAGEMENT, BY REGION, $M<br />
(2015 – 2020)<br />
TABLE 37 GLOBAL NEUROSTIMULATION DEVICES MARKET FOR PARKINSON’S DISEASE, BY REGION,<br />
$M (2011-2014)<br />
TABLE 38 GLOBAL NEUROSTIMULATION DEVICES MARKET FOR PARKINSON’S DISEASE, BY REGION,<br />
$M (2015 – 2020)<br />
TABLE 39 GLOBAL NEUROSTIMULATION DEVICES MARKET FOR URINARY AND FECAL INCONTINENCE,<br />
BY REGION, $M (2011-2014)<br />
TABLE 40 GLOBAL NEUROSTIMULATION DEVICES MARKET FOR URINARY AND FECAL INCONTINENCE<br />
BY REGION, $M (2015 – 2020)<br />
TABLE 41 GLOBAL NEUROSTIMULATION DEVICES MARKET FOR EPILEPSY, BY REGION, $M (2011-2014)<br />
TABLE 42 GLOBAL NEUROSTIMULATION DEVICES MARKET FOR EPILEPSY, BY REGION, $M (2015 –<br />
2020)<br />
TABLE 43 GLOBAL NEUROSTIMULATION DEVICES MARKET FOR HEARING LOSS, BY REGION, $M (2011-<br />
2014)<br />
TABLE 44 GLOBAL NEUROSTIMULATION DEVICES MARKET FOR HEARING LOSS, BY REGION, $M (2015<br />
– 2020)<br />
TABLE 45 GLOBAL NEUROSTIMULATION DEVICES MARKET FOR GASTROPARESIS, BY REGION $M<br />
(2011-2014)<br />
TABLE 46 GLOBAL NEUROSTIMULATION DEVICES MARKET FOR GASTROPARESIS, BY REGION, $M<br />
(2015 – 2020)<br />
TABLE 47 GLOBAL NEUROSTIMULATION DEVICES MARKET FOR DEPRESSION, BY REGION $M (2011-<br />
2014)<br />
TABLE 48 GLOBAL NEUROSTIMULATION DEVICES MARKET FOR DEPRESSION, BY REGION, $M (2015 –<br />
2020)<br />
© P&S <strong>Market</strong> <strong>Research</strong>. All rights reserved 10


