SSEF FACETTE No. 17
SSEF FACETTE No. 17
SSEF FACETTE No. 17

You also want an ePaper? Increase the reach of your titles
YUMPU automatically turns print PDFs into web optimized ePapers that Google loves.
<strong>SSEF</strong> Research<br />
Micro X-ray Tomography of Pearls:<br />
<strong>SSEF</strong> introduces a new service for pearl testing<br />
Recently the <strong>SSEF</strong> Swiss Gemmological Institute<br />
has tested a large number of natural pearls as they<br />
are becoming more important to a specialized sector<br />
of the jewellery market.<br />
However, separating natural pearls from cultured<br />
pearls has never been easy and has become even<br />
more difficult recently with the quantity of beadless<br />
saltwater cultured pearls sold nowadays using<br />
the term ‘new Keshi’. The separation of natural<br />
pearls from cultured ones is commonly based on<br />
analyses of radiographs (and in rare cases X-ray<br />
diffractograms), X-ray luminescence, and meticulous<br />
microscopic observations. The radiographs<br />
(shadowgraphs) may show very fine and subtle<br />
internal structures, which then are interpreted. In<br />
some cases however, even a series of radiographs<br />
is not sufficient for safe identification. That’s why<br />
the <strong>SSEF</strong> now offers a new, sophisticated option in<br />
our pearl testing routine by undertaking a thorough<br />
analysis with micro X-ray tomography.<br />
Computerized tomography, also known as CT-scan,<br />
is not a new invention. Initially developed in the<br />
70’s (1979 <strong>No</strong>belprize for physicist Allan M. Cormack<br />
and electro engineer Godfrey Hounsfield) the<br />
method was quickly adapted for medical research<br />
and diagnostics, as it allows a non-invasive insight<br />
into the body and the processes within.<br />
With further developments of this method, i.e. the<br />
strong increase in resolution (from ca. 5 mm to a<br />
few microns 0.001 mm), it has become useful for<br />
many other applications, especially in material science.<br />
A tomographic analysis always consists of two<br />
phases. Firstly the sample is exposed to a focused<br />
X-ray beam and rotated. Step-by-step, the X-ray<br />
absorption is registered (similar to radiography) on a<br />
planar X-ray detector. And secondly, these projected<br />
images are used to calculate a three-dimensional<br />
reconstruction of the sample. Both X-ray scanning<br />
and reconstruction are quite time, and megabyte,<br />
consuming. The computerized tomographical reconstruction<br />
can then be scrolled through on three<br />
orthogonally oriented virtual slices.<br />
Furthermore, distinct X-ray absorption contrasts<br />
within the sample can be calculated into a 3-dimensional<br />
model, which can be rotated in all directions.<br />
In summary, this method provides a very visual<br />
approach to the analysis of the internal structures of<br />
solids. It has been largely applied for quality analysis<br />
of industrial products (e.g. medicines, foams)<br />
and in-vivo medical research (e.g. bones). Only<br />
recently has X-ray micro tomography been applied<br />
<strong>SSEF</strong> Facette <strong>No</strong>. <strong>17</strong>, © 2010<br />
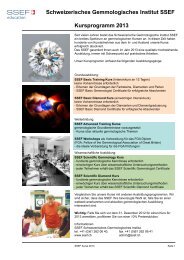
Fig. 1: Baroque-shaped bead, marketed as fossilized<br />
“Neptunian” beads, proved to consist of recent shell<br />
material. © H. A. Hänni, <strong>SSEF</strong> 2008<br />
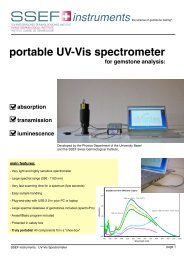
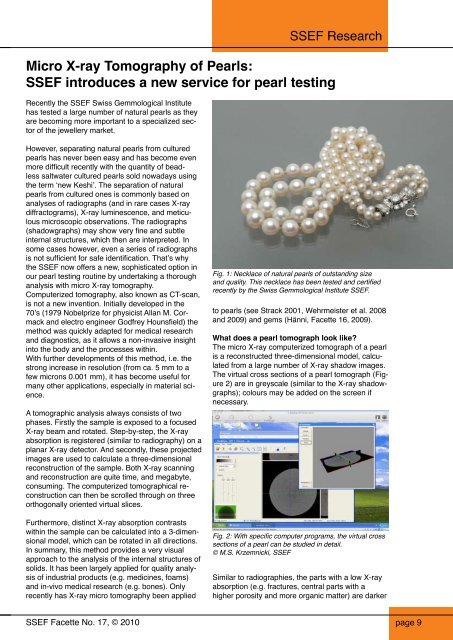
Fig. 1: Necklace of natural pearls of outstanding size<br />
and quality. This necklace has been tested and certified<br />
recently by the Swiss Gemmological Institute <strong>SSEF</strong>.<br />
to pearls (see Strack 2001, Wehrmeister et al. 2008<br />
and 2009) and gems (Hänni, Facette 16, 2009).<br />
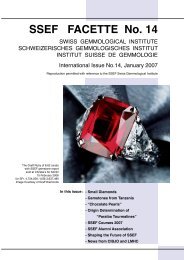
What does a pearl tomograph look like?<br />
The micro X-ray computerized tomograph of a pearl<br />
is a reconstructed three-dimensional model, calculated<br />
from a large number of X-ray shadow images.<br />
The virtual cross sections of a pearl tomograph (Figure<br />
2) are in greyscale (similar to the X-ray shadowgraphs);<br />
colours may be added on the screen if<br />
necessary.<br />
Fig. 2: With specific computer programs, the virtual cross<br />
sections of a pearl can be studied in detail.<br />
© M.S. Krzemnicki, <strong>SSEF</strong><br />
Similar to radiographies, the parts with a low X-ray<br />
absorption (e.g. fractures, central parts with a<br />
higher porosity and more organic matter) are darker<br />
page 9