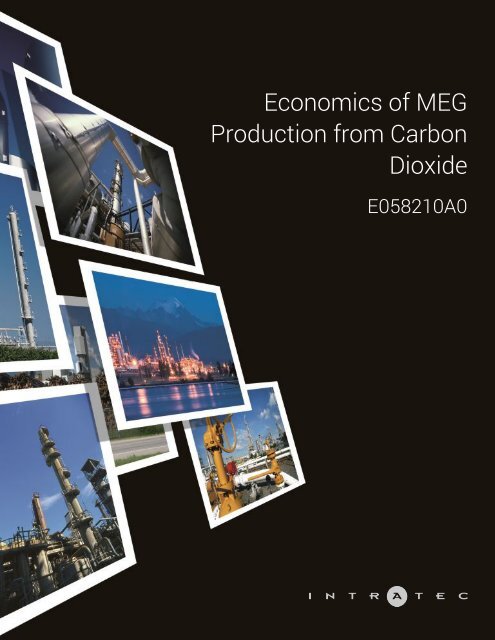
Economics of MEG Production from Carbon Dioxide
This report presents the economics of Monoethylene Glycol (MEG) production from carbon dioxide (CO2) using an electrochemical process. The process examined is similar to Liquid Light process. This report examines one-time costs associated with the construction of a United States-based plant and the continuing costs associated with the daily operation of such a plant. Know more about this and other MEG reports at: www.intratec.us/products/ethylene-glycol-production-processes
This report presents the economics of Monoethylene Glycol (MEG) production from carbon dioxide (CO2) using an electrochemical process. The process examined is similar to Liquid Light process. This report examines one-time costs associated with the construction of a United States-based plant and the continuing costs associated with the daily operation of such a plant. Know more about this and other MEG reports at: www.intratec.us/products/ethylene-glycol-production-processes

Create successful ePaper yourself
Turn your PDF publications into a flip-book with our unique Google optimized e-Paper software.
<strong>Economics</strong> <strong>of</strong> <strong>MEG</strong><br />
<strong>Production</strong> <strong>from</strong> <strong>Carbon</strong><br />
<strong>Dioxide</strong><br />
E058210A0
E058210A0<br />
<strong>Economics</strong> <strong>of</strong> <strong>MEG</strong> <strong>Production</strong> <strong>from</strong> <strong>Carbon</strong> <strong>Dioxide</strong><br />
Industrial Process Report<br />
ABSTRACT<br />
This report presents the economics <strong>of</strong> Monoethylene Glycol (<strong>MEG</strong>) production <strong>from</strong> carbon dioxide (CO2) using an<br />
electrochemical process. The process examined is similar to Liquid Light process. In this process, CO2 is<br />
electrochemically converted to oxalic acid, which is then hydrogenated to <strong>MEG</strong>.<br />
This report examines one-time costs associated with the construction <strong>of</strong> a United States-based plant and the<br />
continuing costs associated with the daily operation <strong>of</strong> such a plant. More specifically, it discusses:<br />
* Capital Investment, broken down by:<br />
- Fixed capital required for production units (ISBL); infrastructure (OSBL) and contingency<br />
- Working capital and costs incurred during industrial plant commissioning and start-up<br />
* <strong>Production</strong> cost, broken down by:<br />
- Manufacturing variable costs (raw materials, utilities)<br />
- Manufacturing fixed costs (maintenance costs, operating charges, plant overhead, local taxes and insurance)<br />
- Depreciation and corporate overhead costs<br />
* <strong>Production</strong> cost history (4-year timeframe)<br />
* Raw materials consumption, products generation and labor requirements<br />
* Process block flow diagram and description <strong>of</strong> industrial site installations (production units and infrastructure)<br />
* Multi-regional fixed capital analysis (United States, China, Germany, Saudi Arabia, Singapore, Japan and Brazil)<br />
This report was developed based essentially on the following reference(s):<br />
US Patents 20140221684 and 20140206895, both issued to Liquid Light in 2014<br />
Keywords: Ethylene Glycol, Fiber Grade, Hydrogen Bromide, Bromine, 1,2-Ethanediol
TERMS OF USE<br />
Data, information, tools, analyses and/or models herein presented are prepared on the basis <strong>of</strong> publicly available<br />
information and non-confidential information disclosed by third parties. Third parties, including, but not limited to<br />
technology licensors, trade associations or marketplace participants, may have provided some <strong>of</strong> the information<br />
on which the analyses or data are based.<br />
The data, information, tools, analyses and/or models herein presented are developed independently by Intratec<br />
and, as such, are the opinion <strong>of</strong> Intratec and do not represent the point <strong>of</strong> view <strong>of</strong> any third parties nor imply in any<br />
way that they have been approved or otherwise authorized by third parties that are mentioned in this report.<br />
Intratec conducts analyses and prepares reports and tools for readers in conformance with generally accepted<br />
pr<strong>of</strong>essional standards. Although the statements in this report are derived <strong>from</strong> or based on several sources that<br />
Intratec believe to be reliable, Intratec does not guarantee their accuracy, reliability, or quality; any such<br />
information, or resulting analyses, may be incomplete, inaccurate or condensed. All estimates included in this<br />
report are subject to change without notice. This report is for informational purposes only and is not intended as<br />
any recommendation <strong>of</strong> investment.<br />
Reader agrees it will not, without prior written consent <strong>of</strong> Intratec, represent, directly or indirectly, that its products<br />
have been approved or endorsed by the other parties. In no event shall Intratec, its employees, representatives,<br />
resellers or distributors be liable to readers or any other person or entity for any direct, indirect, special, exemplary,<br />
punitive, or consequential damages, including lost pr<strong>of</strong>its, based on breach <strong>of</strong> warranty, contract, negligence, strict<br />
liability or otherwise, arising <strong>from</strong> the use <strong>of</strong> this report, whether or not they or it had any knowledge, actual or<br />
constructive, that such damages might be incurred.<br />
Reader agrees that Intratec retains all rights, title and interest, including copyright and other proprietary rights, in<br />
this report and all material, including but not limited to text, images, and other digital files, provided or made<br />
available as part <strong>of</strong> this report. The reader further agrees to refrain <strong>from</strong> any general release <strong>of</strong> the information<br />
presented in this report, so as to constitute passage <strong>of</strong> title into the public domain or otherwise jeopardize<br />
common law or statutory copyright.
TABLE OF CONTENTS<br />
ABOUT THIS REPORT......................................................................................................................................................................5<br />
Study Objective............................................................................................................................................................................ 5<br />
Report Overview...........................................................................................................................................................................5<br />
ABOUT ETHYLENE GLYCOL...........................................................................................................................................................6<br />
Description....................................................................................................................................................................................6<br />
Applications.................................................................................................................................................................................. 6<br />
Fiber Grade Ethylene Glycol <strong>Production</strong> Pathways Diagram.............................................................................................7<br />
PROCESS OVERVIEW...................................................................................................................................................................... 8<br />
Product(s) Generated................................................................................................................................................................. 8<br />
Process Inputs............................................................................................................................................................................. 8<br />
Physico-Chemistry Highlights.................................................................................................................................................. 9<br />
INDUSTRIAL SITE.......................................................................................................................................................................... 10<br />
Introduction................................................................................................................................................................................10<br />
<strong>Production</strong> Units Description..................................................................................................................................................11<br />
Site Infrastructure Description............................................................................................................................................... 16<br />
Key Process Input and Output Figures.................................................................................................................................18<br />
Labor Requirements.................................................................................................................................................................18<br />
CAPITAL INVESTMENT.................................................................................................................................................................19<br />
Fixed Capital...............................................................................................................................................................................20<br />
Working Capital......................................................................................................................................................................... 25<br />
Additional Capital Requirements........................................................................................................................................... 25<br />
Total Capital Investment Summary...................................................................................................................................... 26<br />
PRODUCTION COSTS....................................................................................................................................................................27<br />
Manufacturing Variable Costs................................................................................................................................................29<br />
Manufacturing Fixed Costs.....................................................................................................................................................30<br />
Corporate Overhead................................................................................................................................................................. 30<br />
Depreciation............................................................................................................................................................................... 31<br />
Total <strong>Production</strong> Cost.............................................................................................................................................................. 31
<strong>Production</strong> Cost History.......................................................................................................................................................... 32<br />
PROCESS ECONOMICS SUMMARY...........................................................................................................................................33<br />
LABOR WAGE RATES & PRICING BASIS...................................................................................................................................35<br />
REFERENCES..................................................................................................................................................................................37<br />
ANALYSIS METHODOLOGY......................................................................................................................................................... 39<br />
Introduction................................................................................................................................................................................39<br />
Bibliographical Research.........................................................................................................................................................39<br />
Process Overview......................................................................................................................................................................39<br />
Examining an Industrial Site................................................................................................................................................... 41<br />
Capital Investment Estimating...............................................................................................................................................42<br />
<strong>Production</strong> Cost Estimating....................................................................................................................................................47<br />
Product Value Estimating........................................................................................................................................................49<br />
Estimates Limitation................................................................................................................................................................ 50<br />
ABOUT INTRATEC..........................................................................................................................................................................51<br />
Our Business.............................................................................................................................................................................. 51<br />
Our Reports................................................................................................................................................................................ 51<br />
APPENDIX 1: FIXED CAPITAL REGIONAL COMPARISON..................................................................................................... 53<br />
APPENDIX 2: INTRATEC CHEMICAL PLANT CONSTRUCTION INDEX...............................................................................54
ABOUT THIS REPORT<br />
Study Objective<br />
This report presents the economics <strong>of</strong> Monoethylene Glycol (<strong>MEG</strong>) production <strong>from</strong> carbon dioxide (CO2) using an<br />
electrochemical process. The process examined is similar to Liquid Light process.<br />
The primary objective <strong>of</strong> this study is to explain the cost structure <strong>of</strong> the aforementioned process, encompassing<br />
capital investment and production cost figures.<br />
The process design and economics in this report are based on an industrial facility with a nominal production<br />
capacity <strong>of</strong><br />
per year, a capacity that is globally competitive.<br />
In addition, the economic assessment, developed for the period<br />
, assumes the construction <strong>of</strong> a United<br />
States-based industrial facility that includes the infrastructure typically required for such a project.<br />
Report Overview<br />
This report is structured into eight main parts which follow a logical sequence. Each <strong>of</strong> these parts is described<br />
below.<br />
By way <strong>of</strong> introduction, the first part – the current chapter – briefly explains the report itself, its structure and<br />
objective. Readers are encouraged to spend a few minutes reading this chapter, so as to make the most <strong>of</strong> the<br />
study.<br />
In the second part, About Ethylene Glycol, the reader will learn the basics <strong>of</strong> Ethylene Glycol itself. This chapter also<br />
covers its applications and major production pathways.<br />
The third part, Process Overview, presents basic aspects <strong>of</strong> the process studied: products generated, process<br />
inputs, and physico-chemistry highlights.<br />
The fourth part, Industrial Site, describes an industrial plant based on the process under analysis, in terms <strong>of</strong> the<br />
production units and infrastructure required. This technical analysis underlies the entire study.<br />
The fifth part, Capital Investment, presents all capital costs associated with the process examined, <strong>from</strong> design and<br />
erection <strong>of</strong> an industrial site to plant startup.<br />
Operational Expenses <strong>of</strong> the process are examined in the sixth part. Ongoing costs related to the operation <strong>of</strong> a unit<br />
based on the process are studied, including manufacturing fixed costs, manufacturing variable costs, depreciation<br />
and corporate overhead.<br />
The seventh part, Process <strong>Economics</strong> Summary, summarizes all economic figures presented throughout the report.<br />
Finally, to address any questions or concerns about the methodologies and procedures adopted in the<br />
development <strong>of</strong> this report, the reader is referred to the eighth part, Analysis Methodology.<br />
5
ABOUT ETHYLENE GLYCOL<br />
Description<br />
Monoethylene Glycol (<strong>MEG</strong>) is a diol, a chemical compound that contains two hydroxyl groups. <strong>MEG</strong> is also known<br />
as Ethylene Glycol and presents the chemical formula C2H6O2, being the simplest diol.<br />
Ethylene Glycol is a colorless, practically odorless, low viscosity, hygroscopic liquid at room temperature.<br />
Commercially, Ethylene Glycol is available in three grades:<br />
* Fiber Grade: min. 99.8% <strong>of</strong> purity<br />
* Industrial Grade: min. 99.5% <strong>of</strong> purity<br />
* Antifreeze Grade: min. 98% <strong>of</strong> purity<br />
Applications<br />
Ethylene Glycol is a major industrial product and it is widely applied in the production <strong>of</strong> polyester fibers and<br />
polyethylene terephthalate (PET) resins. For such application, Fiber Grade Ethylene Glycol is used, since high<br />
purity feedstock is necessary.<br />
Ethylene Glycol is also applied as a base compound in antifreeze formulations employed in automobile<br />
applications. Other usages <strong>of</strong> Ethylene Glycol include heat transfer, gas dehydration and solvent applications.<br />
6
Fiber Grade Ethylene Glycol <strong>Production</strong> Pathways Diagram<br />
Monoethylene Glycol can be manufactured <strong>from</strong> several raw materials. Globally, the largest volume <strong>of</strong><br />
Monoethylene Glycol is produced <strong>from</strong> ethylene via ethylene oxide intermediate, generating di- and tri-ethylene<br />
glycol as well. The following chart presents different pathways for Fiber Grade Ethylene Glycol production.<br />
7
PROCESS OVERVIEW<br />
This chapter presents technical aspects <strong>of</strong> the Monoethylene Glycol (<strong>MEG</strong>) production <strong>from</strong> carbon dioxide (CO2)<br />
using an electrochemical process.<br />
More specifically, the current chapter describes the products generated, the process inputs, and highlights about<br />
the physico-chemistry related to this process.<br />
Product(s) Generated<br />
The only product <strong>of</strong> the process is Fiber Grade Ethylene Glycol.<br />
Process Inputs<br />
Raw Material(s)<br />
* Electricity<br />
As well as in other electrochemical processes, electricity is considered one <strong>of</strong> the main raw materials <strong>of</strong> the<br />
analyzed process.<br />
* <strong>Carbon</strong> <strong>Dioxide</strong><br />
<strong>Carbon</strong> dioxide (CO2) is a colorless gas, mainly produced as a by-product <strong>of</strong> combustion <strong>of</strong> fossil fuels and<br />
fermentation processes.<br />
* Hydrogen<br />
The hydrogen molecule, H2, is the normal state <strong>of</strong> pure hydrogen, even though hydrogen can be found in its atomic<br />
form under specific conditions. It is a very stable molecule, not usually reactive under normal conditions.<br />
Essentially, molecular hydrogen is produced industrially by three different methods: hydrocarbons steam<br />
reforming, hydrocarbons partial oxidation and water electrolysis.<br />
Hydrogen can also be obtained as a by-product recovered in processes such as the manufacture <strong>of</strong> styrene <strong>from</strong><br />
ethylbenzene.<br />
Utilities<br />
The utilities consumed in the process are cooling water and high pressure steam. The process also requires the<br />
consumption <strong>of</strong> some chemicals necessary for the maintenance <strong>of</strong> the electrodes and membranes utilized in the<br />
electrochemical reaction.<br />
8
Physico-Chemistry Highlights<br />
In this process, <strong>MEG</strong> is produced <strong>from</strong> carbon dioxide (CO2) via oxalic acid. First, CO2 is electrochemically<br />
reduced into oxalate and bromide is oxidized into bromine (Br2), as indicated in equations (1) and (2). The<br />
catholyte and anolyte used in this step are tetrabutylammonium bromide (TBA-Br) salt dissolved in acetonitrile<br />
solvent.<br />
Next, oxalate is acidified to oxalic acid using hydrogen bromide (HBr) formed by the reaction <strong>of</strong> bromine with<br />
hydrogen (H2), as presented in equations (3) and (4). Then, oxalic acid is esterified with methanol producing<br />
dimethyl oxalate, which is hydrogenated forming Ethylene Glycol product, as shown in equations (5) and (6).<br />
Besides Ethylene Glycol, some impurities such as methyl glycolate, 1,2-butanediol and some heavy compounds<br />
are formed during the hydrogenation reaction.<br />
(1) 2 (CO2) + 2 (TBA+) --> TBA2-oxalate<br />
(2) 2 (TBA-Br) --> bromine + 2 (TBA+)<br />
(3) TBA2-oxalate + 2 (hydrogen bromide) --> oxalic acid + 2 (TBA-Br)<br />
(4) bromine + H2 --> 2 (hydrogen bromide)<br />
(5) oxalic acid + 2 (methanol) --> dimethyl oxalate + 2 (H2O)<br />
(6) dimethyl oxalate + H2 --> <strong>MEG</strong> + 2 (methanol)<br />
9
INDUSTRIAL SITE<br />
This chapter presents all installations that comprise an industrial site for Monoethylene Glycol (<strong>MEG</strong>) production<br />
<strong>from</strong> carbon dioxide (CO2) using an electrochemical process. The process examined is similar to Liquid Light<br />
process.<br />
The present study was mainly based on:<br />
US Patents 20140221684 and 20140206895, both issued to Liquid Light in 2014<br />
Introduction<br />
The information presented in this chapter is based on commonly utilized concepts related to the type <strong>of</strong><br />
installations found within a typical industrial site. These concepts include:<br />
* <strong>Production</strong> units. Also known as inside battery units, these installations comprise all main processing units <strong>of</strong><br />
the site necessary to the manufacturing <strong>of</strong> products. These units are located Inside the Battery Limits (ISBL).<br />
* Infrastructure. Also known as outside battery units or <strong>of</strong>fsite facilities, these installations do not directly enter<br />
into the manufacturing <strong>of</strong> a product. They are support buildings, auxiliary units used for providing and distributing<br />
utilities and storage facilities. These units are located Outside the Battery Limits (OSBL).<br />
<strong>Production</strong> Units<br />
<strong>Production</strong> units form the core <strong>of</strong> an industrial site. Comprising the site’s battery limits (ISBL), such units may be<br />
numerous, complex and involve several pieces <strong>of</strong> equipment. In this context, the most didactic approach to<br />
presenting all production units <strong>of</strong> a site is through the use <strong>of</strong> a block flow diagram. Visual information is, in fact, the<br />
clearest way to present a chemical process and is least likely to be misinterpreted.<br />
In general, these diagrams consist <strong>of</strong> a series <strong>of</strong> blocks, representing unit operations or groups <strong>of</strong> equipment,<br />
connected by input and output streams. In fact, there are no strict standards according to which such diagrams<br />
are made.<br />
To facilitate the presentation <strong>of</strong> the production units under analysis, Intratec developed a block flow diagram<br />
according to the following standards:<br />
* Raw materials consumed are represented by blocks in gray<br />
* Main process areas are represented by blocks in light blue<br />
* Products and by-products generated are represented by blocks in dark blue<br />
* Main process streams are represented by lines connecting the blocks<br />
10
The figure below illustrates the type <strong>of</strong> information presented in the block flow diagram, according to such<br />
standards.<br />
The process areas represented (in light blue) correspond to what is defined as a “functional unit”. Basically, a<br />
“functional unit” is a significant step in the production process in which a particular physico-chemical operation (i.<br />
e., distillation, reaction, evaporation) occurs. According to this definition, a given functional unit is not associated<br />
with a single piece <strong>of</strong> equipment, but rather with a group <strong>of</strong> equipment and ancillaries required to perform a<br />
particular operation.<br />
Blocks representing process areas also show key technical parameters related to these areas, including: highest<br />
operating temperature and pressure, representative material <strong>of</strong> construction, and other parameters.<br />
As to the process streams represented, there is an indication <strong>of</strong> their phase when leaving/entering a block. Also,<br />
such streams provide a global material balance <strong>of</strong> the process, normalized by the mass flow rate <strong>of</strong> the product<br />
considered in the analysis. In other words, the number near each stream represents the ratio between its mass<br />
flow rate and the output flow rate <strong>of</strong> the product under analysis.<br />
It is worth noting that areas having no significant impact on the economics <strong>of</strong> the process may not be included in<br />
the diagram. Similarly, some streams may also not be represented. Nevertheless, the diagram presented is still<br />
extremely useful in providing readers with an overall understanding and “feeling” <strong>of</strong> the process studied.<br />
For more information on how the process examined was divided into functional units, the reader is referred to the<br />
section on <strong>Production</strong> Units in the “Analysis Methodology” chapter.<br />
Site Infrastructure<br />
Infrastructure requirements comprise the <strong>of</strong>fsite facilities, or the units located Outside the Battery Limits (OSBL).<br />
The OSBL usually have a significant impact on the capital cost estimates associated with any new industry<br />
venture. This impact is largely dictated by, among other things: specific conditions where the industrial site will be<br />
erected; the level <strong>of</strong> integration the new site will have with nearby facilities or industrial complexes; and assurance<br />
and promptness in the supply <strong>of</strong> chemicals.<br />
<strong>Production</strong> Units Description<br />
The production units related to the process under analysis are described based on the above explanation. On the<br />
next page, a block flow diagram illustrates the production units examined.<br />
11
12
13
The process under analysis is briefly described below. For clarity, the description was divided according to the<br />
process areas indicated in the diagram.<br />
It is important to mention that some aspects <strong>of</strong> the process examined are either industrial secrets, not published in<br />
patents, or have changed and were not reported in the literature at the time this report was developed. That being<br />
the case, the design herein presented is partially based on Intratec process synthesis knowledge such that there<br />
may be some differences between the industrial process actually employed and the process described in this<br />
study. Nevertheless, the design presented suitably represents the technology examined in sufficient detail to<br />
estimate the economics <strong>of</strong> the technology within the degree <strong>of</strong> accuracy expected <strong>from</strong> conceptual evaluations.<br />
14
15
Site Infrastructure Description<br />
The infrastructure requirements <strong>of</strong> the industrial site examined are defined based on the following assumptions:<br />
The figure below illustrates the configuration <strong>of</strong> the industrial complex that encompasses the industrial process<br />
examined. The <strong>of</strong>fsite facilities considered in the analysis (i.e., areas 90, 91 and 92) were defined according to the<br />
aforementioned assumptions.<br />
16
Finally, <strong>of</strong>fsite facilities were divided into areas according to their type/function. These areas are listed below, as<br />
well as the major equipment, systems and facilities included in each <strong>of</strong> them.<br />
17
Key Process Input and Output Figures<br />
In accordance with the block flow diagram and the global material balance previously presented, the following<br />
tables show key process indicators <strong>of</strong> the technology examined in this report. These indicators reflect the raw<br />
material consumption and the products generation rates per metric ton <strong>of</strong> Fiber Grade Ethylene Glycol produced.<br />
Raw Materials Consumption<br />
RAW MATERIAL<br />
CONSUMPTION PER METRIC TON OF PRODUCT<br />
UNIT<br />
It should be noted that estimation <strong>of</strong> raw material requirements in the conceptual design phase is usually<br />
reasonably accurate but tends to be somewhat understated compared to real operations. Losses <strong>from</strong> vessel<br />
vents, unscheduled equipment, inerting systems, physical property inaccuracies, startup, shutdown and other<br />
process operations not typically addressed in this phase may increase raw materials consumption.<br />
Labor Requirements<br />
The following table presents the number <strong>of</strong> operators per shift required to run the equipment <strong>of</strong> the process<br />
examined, as well as the personnel per shift required to directly supervise the operating labor.<br />
Labor Requirements<br />
PERSONNEL REQUIRED<br />
WORKERS PER SHIFT<br />
Operators<br />
Supervisors<br />
18
CAPITAL INVESTMENT<br />
This chapter details all capital costs associated with Monoethylene Glycol (<strong>MEG</strong>) production <strong>from</strong> carbon dioxide<br />
(CO2) using an electrochemical process, <strong>from</strong> design and erection <strong>of</strong> an industrial site to plant startup.<br />
The costs that comprise the total capital investment are grouped under three main headings:<br />
* Total fixed capital. Investment necessary to the erection <strong>of</strong> the industrial plant itself<br />
* Working capital. Funds required for getting the plant into operation, and meeting subsequent obligations<br />
* Additional capital requirements. Costs incurred during industrial plant commissioning and start-up<br />
The graph below illustrates the composition <strong>of</strong> total capital investment.<br />
The estimates included in this chapter are based on the following assumptions:<br />
* Plant nominal capacity: <strong>of</strong> Fiber Grade Ethylene Glycol per year<br />
* Industrial plant location: United States<br />
* Construction on a cleared, level site<br />
* Period <strong>of</strong> analysis:<br />
* IC Index at the period <strong>of</strong> analysis:<br />
19
The IC Index stands for Intratec Chemical Plant Construction Index, an indicator published monthly by Intratec to<br />
scale capital costs <strong>from</strong> one time period to another. This index reconciles the price trends <strong>of</strong> fundamental<br />
components <strong>of</strong> chemical plant construction such as labor, material and energy, providing meaningful historical<br />
and forecast data for our readers and clients. For more information about the IC Index, the reader is referred to<br />
Appendix II – Intratec Chemical Plant Construction Index.<br />
In the next pages capital costs are described in further detail, and estimates calculated are presented. For more<br />
information on the methods employed for estimating the costs presented, the reader is referred to the “Analysis<br />
Methodology” chapter.<br />
Fixed Capital<br />
Fixed capital is related to the erection <strong>of</strong> the industrial site itself. Also referred as “capital expenditures” (CAPEX),<br />
fixed capital constitutes the fraction <strong>of</strong> the capital investment which is depreciable.<br />
It includes Total Process Capital (TPC) and Project Contingency, as described below.<br />
Total Process Capital encompasses the investment required for the construction <strong>of</strong>: (1) process areas previously<br />
presented in the "Process Block Flow Diagram" (ISBL investment); (2) the site infrastructure (OSBL Investment),<br />
also previously discussed; and (3) a process contingency reflecting technical uncertainties associated with limited<br />
design data, which may incur capital cost increases (e.g., additional equipment not included in the preliminary<br />
design).<br />
Project Contingency, on the other hand, is included to cover the costs which may arise as the project evolves.<br />
Such costs include: project errors or incomplete specifications, labor costs changes, strikes, problems caused by<br />
weather; inflation, etc.<br />
The table below summarizes all items that make up the fixed capital cost:<br />
Fixed Capital Summary (USD Million)<br />
COMPONENT LOWER LIMIT UPPER LIMIT ESTIMATED %<br />
Inside battery limits (ISBL)<br />
Process contingency (<br />
<strong>of</strong> ISBL)<br />
Outside battery limits (OSBL)<br />
Total process capital (TPC)<br />
Project contingency (<br />
<strong>of</strong> TPC)<br />
TOTAL FIXED CAPITAL<br />
The above table also presents the upper and lower limits for the fixed capital figures, according to the accuracy<br />
range expected <strong>from</strong> conceptual evaluations presented in this report. The presented range is associated with a<br />
confidence level <strong>of</strong> 90%. In other words, a 90% confidence level means that, for every 100 times the project is<br />
actually implemented, the fixed capital required will fall into the range predicted with our estimates 90 times.<br />
20
For a better understanding <strong>of</strong> the costs involved in a new industrial venture, it is a common estimation practice to<br />
divide the fixed capital into direct process costs, indirect process costs and project contingency.<br />
Fundamentally, the direct process costs are all material and labor costs associated with the process equipment<br />
(<strong>from</strong> purchase to installation, including the required installation bulks). In short, the total direct cost represents the<br />
total installed equipment cost.<br />
The indirect costs account for field indirects, engineering costs, overhead, and contract fees. Indirect costs are<br />
defined by the American Association <strong>of</strong> Cost Engineers (AACE) Standard Terminology as those "costs which do<br />
not become a final part <strong>of</strong> the installation but which are required for the orderly completion <strong>of</strong> the installation."<br />
Accordingly, the chart below presents the fixed capital broken down by direct process costs, indirect costs and<br />
project contingency.<br />
Fixed Capital Composition<br />
The two charts in the next page detail the composition <strong>of</strong> direct field costs and indirect costs, respectively.<br />
21
Direct Costs Composition<br />
Indirect Costs Composition<br />
22
The next table presents the detailed fixed capital breakdown, based on the direct and indirect costs approach.<br />
Fixed Capital Breakdown<br />
COMPONENT<br />
Bare equipment (BEQ)<br />
Equipment setting<br />
Piping<br />
Civil<br />
Steel<br />
Instrumentation & control<br />
Electrical<br />
Insulation<br />
Painting<br />
Direct costs<br />
Engineering & procurement<br />
Construction material & indirects<br />
General & administrative overheads<br />
Contract fee<br />
Indirect costs<br />
MM USD<br />
% OF BEQ % OF TOTAL<br />
Total process capital (TPC)<br />
Project contingency (<br />
<strong>of</strong> TPC)<br />
TOTAL FIXED CAPITAL<br />
It is worth noting that the process contingency presented in the Table "Fixed Capital Summary" is included within<br />
each component listed in the table above.<br />
For further information about the components included in the fixed capital breakdown, reader is referred to the<br />
chapter “Analysis Methodology”.<br />
23
Of course, fixed capital is greatly impacted by the plant capacity assumed. In this context, a plant scale analysis<br />
was also performed in order to depict how the total capital required varies according to the plant capacity. The<br />
analysis results are presented in the next figure.<br />
Fixes Capital as Function <strong>of</strong> Plant Capacity (USD Million)<br />
Finally, <strong>from</strong> the analysis previously presented, the fixed capital per metric ton produced was calculated. This<br />
parameter allows readers to compare processes in regards to how capital intensive they are. Also, it can be used<br />
to measure the impact <strong>of</strong> plant scale on the total fixed capital and determine a minimum plant capacity that will be<br />
economically feasible.<br />
Fixed Capital per Unit <strong>of</strong> Plant Capacity (USD / Metric Ton)<br />
24
Working Capital<br />
For the purposes <strong>of</strong> this study, working capital is defined as the funds, in addition to the fixed capital, that a<br />
company must contribute to a project. Those funds must be adequate to bringing the plant into operation and<br />
meeting subsequent obligations.<br />
Working capital includes: raw materials inventory, products inventory, in-process inventory, supplies and stores,<br />
accounts receivable and accounts payable.<br />
The table below presents a breakdown <strong>of</strong> working capital. Unless otherwise indicated, all figures presented are in<br />
US million dollars (MM USD).<br />
Working Capital Breakdown (USD Million)<br />
COMPONENT<br />
ASSUMPTION<br />
MM USD<br />
%<br />
Accounts receivable<br />
day(s) <strong>of</strong> total production cost<br />
Accounts payable<br />
day(s) <strong>of</strong> operating cash cost + corporate overhead<br />
Net accounts receivable<br />
Raw materials inventory<br />
day(s) <strong>of</strong> raw materials costs<br />
Products inventory<br />
day(s) <strong>of</strong> total production cost<br />
In-process inventory<br />
day(s) <strong>of</strong> operating cash cost + corporate overhead<br />
Supplies and stores<br />
<strong>of</strong> annual operating labor and maintenance costs<br />
Cash on hand<br />
day(s) <strong>of</strong> operating cash cost + corporate overhead<br />
TOTAL WORKING CAPITAL<br />
Additional Capital Requirements<br />
Several expenses are incurred during commissioning and start-up <strong>of</strong> an industrial site. These expenses may be<br />
related to:<br />
* Employee training<br />
* Initial commercialization costs<br />
* Manufacturing inefficiencies and unscheduled plant modifications (equipment, piping, instruments, etc.)<br />
* Initial catalyst load in reactors<br />
* Purchase <strong>of</strong> technology through paid-up royalties or licenses<br />
* Land acquisition and site development<br />
Such additional costs are not addressed in most studies, but can become a significant expenditure. In the current<br />
analysis, these costs are represented by additional capital requirements.<br />
The table below presents a breakdown <strong>of</strong> additional capital investment.<br />
presented are in US million dollars (MM USD).<br />
Unless otherwise indicated, all figures<br />
25
Additional Capital Requirements Breakdown (USD Million)<br />
COMPONENT<br />
ASSUMPTION<br />
MM USD<br />
%<br />
Operator training<br />
day(s) <strong>of</strong> all labor costs<br />
Commercialization costs<br />
<strong>of</strong> annual operating cash cost + corporate overhead<br />
Initial catalyst load<br />
Start-up innefficiencies<br />
<strong>of</strong> annual operating cash cost + corporate overhead<br />
Unscheduled plant modifications<br />
<strong>of</strong> fixed capital<br />
Start-up costs<br />
Land & site development<br />
<strong>of</strong> fixed capital<br />
Prepaid royalties<br />
<strong>of</strong> fixed capital<br />
TOTAL ADDITIONAL CAPITAL<br />
Total Capital Investment Summary<br />
The table below summarizes all major capital costs discussed thus far, <strong>from</strong> the design and erection <strong>of</strong> an<br />
industrial site to plant startup.<br />
Capital Investment Summary<br />
COMPONENT<br />
Fixed capital<br />
Working capital<br />
Additional capital requirements<br />
TOTAL CAPITAL INVESTMENT<br />
MM USD<br />
%<br />
For more information about how the capital costs were estimated, the reader is referred to section on Capital<br />
Investment Estimating in the “Analysis Methodology” chapter.<br />
26
PRODUCTION COSTS<br />
This chapter details all ongoing costs required for Monoethylene Glycol (<strong>MEG</strong>) production <strong>from</strong> carbon dioxide<br />
(CO2) using an electrochemical process. Also referred as operational expenditures (OPEX), these encompass<br />
costs associated with the plant operation, selling <strong>of</strong> products, and contribution to corporate functions (e.g.,<br />
administration and R&D activities). In the current analysis, the production cost was grouped under four main<br />
headings:<br />
* Manufacturing fixed costs. Operating costs directly tied to the plant capacity, but which do not change with the<br />
production level (i.e., operating labor, supervision labor, maintenance costs, plant overhead)<br />
* Manufacturing variable costs. Costs directly proportional to the actual production <strong>of</strong> the industrial site (i.e. raw<br />
materials and utilities consumption)<br />
* Depreciation. Refers to the decrease in value <strong>of</strong> industrial assets with passage <strong>of</strong> time<br />
* Corporate overhead. Corporate expenses related to administration, research and development, market and<br />
distribution<br />
It should be kept in mind that the sum <strong>of</strong> manufacturing fixed costs and manufacturing variable costs is referred<br />
as “cash cost”. The sum <strong>of</strong> cash cost with depreciation and corporate overhead, in turn, is referred to as<br />
“production cost”.<br />
The graph below illustrates the composition <strong>of</strong> production cost.<br />
27
The estimates included in this chapter are based on the following assumptions:<br />
* Industrial plant location: United States<br />
* Period <strong>of</strong> analysis:<br />
* Plant nominal capacity: <strong>of</strong> Fiber Grade Ethylene Glycol per year<br />
* Plant operating rate:<br />
The plant operating rate assumed leads to an annual production <strong>of</strong><br />
. It is important to<br />
mention that this rate does not represent any technology limitation; rather, it is an assumption based on usual<br />
industrial operating rates.<br />
In the next pages the production cost items are described in further detail, and estimates calculated are presented.<br />
For more information on the methods employed to estimate the costs presented, the reader is referred to the<br />
“Analysis Methodology” chapter.<br />
28
Manufacturing Variable Costs<br />
Variable costs change in direct proportion to changes in the production level. Such costs include raw materials<br />
and utilities (i.e., steam, electricity, fuel, and refrigeration).<br />
The next table displays the manufacturing variable costs.<br />
Manufacturing Variable Costs Breakdown<br />
COMPONENT<br />
QUANTITY PER MT PRICE USD/MT MM USD/YR<br />
%<br />
Net raw materials cost<br />
Net utilities cost<br />
MANUFACTURING VARIABLE COSTS<br />
All variable costs presented in this table are derived <strong>from</strong> unit consumptions, detailed in the previous chapter, and<br />
pricing information.<br />
29
Manufacturing Fixed Costs<br />
Manufacturing fixed costs are the costs primarily related to the production capacity <strong>of</strong> an industrial site, but which<br />
do not change with production volume. Such costs include maintenance costs, operating charges, plant overhead,<br />
local taxes and insurance.<br />
The table below presents a breakdown <strong>of</strong> manufacturing fixed costs.<br />
Manufacturing Fixed Costs Breakdown<br />
COMPONENT<br />
ASSUMPTION<br />
USD/MT<br />
MM USD/YR %<br />
Operating labor<br />
Supervision<br />
Maintenance cost<br />
operators/shift ;<br />
supervisors/shift ;<br />
<strong>of</strong> fixed capital<br />
USD/oper./h<br />
USD/sup./h<br />
Operating charges<br />
Plant overhead<br />
Property taxes and insurance<br />
<strong>of</strong> operating labor costs<br />
<strong>of</strong> operating labor and maintenance costs<br />
<strong>of</strong> fixed capital<br />
MANUFACTURING FIXED COSTS<br />
Corporate Overhead<br />
Corporate overhead is associated with costs incurred by a company’s head <strong>of</strong>fice such as general administrative<br />
costs, research and development activities, market and product distribution.<br />
The table below presents a breakdown <strong>of</strong> corporate overhead costs.<br />
Corporate Overhead Costs Breakdown<br />
COMPONENT<br />
ASSUMPTION<br />
USD/MT<br />
MM USD/YR %<br />
Administration costs<br />
<strong>of</strong> operating labor and maintenance costs<br />
Market & distribution<br />
<strong>of</strong> operating cash costs at full capacity<br />
Research & development<br />
<strong>of</strong> operating cash costs at full capacity<br />
CORPORATE OVERHEAD<br />
30
Depreciation<br />
Depreciation refers to the decrease in value <strong>of</strong> industrial assets with passage <strong>of</strong> time, primarily because <strong>of</strong> wear<br />
and tear. While not a true manufacturing cost, depreciation is considered to be a manufacturing expense for<br />
accounting purposes – it allows the recovery <strong>of</strong> the cost <strong>of</strong> an asset over a time period.<br />
In this study, the depreciation is USD per metric ton <strong>of</strong> Fiber Grade Ethylene Glycol produced.<br />
This calculation was based on the straight-line method and a project economic life <strong>of</strong> 10 years.<br />
Total <strong>Production</strong> Cost<br />
The table below summarizes all production cost components discussed thus far.<br />
<strong>Production</strong> Cost Summary<br />
COMPONENT<br />
Manufacturing variable costs<br />
Manufacturing fixed costs<br />
Operating cash costs<br />
Corporate overhead<br />
Depreciation<br />
TOTAL PRODUCTION COST<br />
USD/MT<br />
MM USD/YR %<br />
For more information about how the production cost components were estimated, the reader is referred to the<br />
section on <strong>Production</strong> Cost Estimating in the “Analysis Methodology” chapter.<br />
31
<strong>Production</strong> Cost History<br />
In order to provide a more consistent view <strong>of</strong> production economics, this analysis also compares the way in which<br />
production cost has evolved over time. In this context, production cost was recalculated for the last 4 years, on<br />
quarterly basis.<br />
The production cost historical series is presented in the figure below.<br />
<strong>Production</strong> Cost History (USD/metric ton)<br />
32
PROCESS ECONOMICS SUMMARY<br />
Heret<strong>of</strong>ore, the capital cost and production cost related to the process examined were described. This chapter<br />
provides a summary <strong>of</strong> all capital and production costs related to the process described so far. Also, in order to<br />
provide a more consistent economic analysis <strong>of</strong> the process examined, all such costs are combined in a single<br />
item: “Product Value”.<br />
“Product value” is a term commonly used wherein all costs associated with the manufacture <strong>of</strong> a product are<br />
combined. More specifically, it includes the production cost (manufacturing variable costs, manufacturing fixed<br />
costs, corporate overhead costs and depreciation), as well as an expected return on capital employed (ROCE).<br />
Product value should not be confused with product price. While product value, as previously mentioned, is<br />
calculated based on the costs associated with the manufacture <strong>of</strong> a product, product price is the actual value as<br />
seen in the market.<br />
The graph below illustrates the composition <strong>of</strong> the product value.<br />
The table on the next page condenses the analysis developed in this report.<br />
33
<strong>Economics</strong> <strong>of</strong> <strong>MEG</strong> <strong>Production</strong> <strong>from</strong> <strong>Carbon</strong> <strong>Dioxide</strong> - Datasheet<br />
BASIS:<br />
PLANT CAPACITY & OPERATION<br />
Nominal capacity<br />
Operating rate<br />
Annual production<br />
CAPITAL INVESTMENT SUMMARY<br />
Fixed capital<br />
Working capital<br />
Additional capital<br />
TOTAL CAPITAL INVESTMENT<br />
MM USD<br />
DESCRIPTION<br />
QUANTITY PER MT PRICE USD/MT MM USD/YR<br />
%<br />
Net raw materials cost<br />
Net utilities cost<br />
MANUFACTURING VARIABLE COSTS<br />
Operating labor<br />
Supervision<br />
Maintenance cost<br />
Operating charges<br />
Plant overhead<br />
Prop. taxes and insur.<br />
oper./shift<br />
USD/oper./h<br />
sup./shift<br />
USD/sup./h<br />
<strong>of</strong> fixed capital<br />
<strong>of</strong> operating labor costs<br />
operating labor and maintenance costs<br />
<strong>of</strong> fixed capital<br />
MANUFACTURING FIXED COSTS<br />
OPERATING CASH COST<br />
Administration costs<br />
<strong>of</strong> operating labor and maintenance costs<br />
Marketing & distribution<br />
<strong>of</strong> operating cash costs at full capacity<br />
Research & development <strong>of</strong> operating cash costs at full capacity<br />
CORPORATE OVERHEAD<br />
Depreciation<br />
ROCE<br />
TOTAL PRODUCTION COST<br />
PRODUCT VALUE<br />
<strong>of</strong> total capital investment<br />
34
LABOR WAGE RATES & PRICING BASIS<br />
This chapter presents the labor wage rates, as well as raw materials and products prices used in the economic<br />
analysis for the current report.<br />
Labor Wage Rates (USD/hour)<br />
PERIOD OPERATOR SUPERVISOR<br />
35
Pricing Basis<br />
PERIOD<br />
36
REFERENCES<br />
37
38
ANALYSIS METHODOLOGY<br />
Introduction<br />
Intratec distilled its expertise, gained <strong>from</strong> more than a decade <strong>of</strong> supporting companies worldwide in the analysis<br />
<strong>of</strong> chemical markets and process economics, and developed a consistent report development methodology.<br />
The Intratec Industrial Process methodology ensures a holistic, coherent and consistent techno-economic<br />
evaluation, guiding the development <strong>of</strong> a report that allows readers to fully understand a specific chemical process<br />
technology.<br />
In addition to being based on a common methodology, all Intratec Industrial Process reports have a common<br />
structure, i.e., indexes, tables and charts share similar standards. This ensures that Intratec’s readers know<br />
upfront what they will get and, more than that, will be able to compare technologies addressed in different reports.<br />
Our methodology is continuously tested and proven by the many chemical and oil corporations, R&D centers, EPC<br />
companies, financial institutions and government agencies that rely on our reports.<br />
The methodology used in the development <strong>of</strong> Industrial Processes <strong>Economics</strong> reports is illustrated in the diagram<br />
presented on the next page.<br />
Bibliographical Research<br />
The report is based on a comprehensive bibliographical research, entirely focused on the industrial process to be<br />
examined. Our research encompasses patents, encyclopedias, text books, technical papers and non-confidential<br />
information disclosed by licensors, duly reviewed by the Intratec team.<br />
The main goal <strong>of</strong> this research is to provide a solid understanding <strong>of</strong> the process examined, which in fact underlies<br />
the entire study. During this research, Intratec team identifies the maturity <strong>of</strong> the process under analysis.<br />
Basically, established processes are mature industrial processes, i.e., several plants employing these processes<br />
have been constructed worldwide, while new industrial processes are those that have only been employed in a few<br />
plants constructed around the world. Finally, early-stage industrial processes are the processes still under<br />
development; currently, either no plants have employed such technologies or the designs <strong>of</strong> the processes<br />
themselves have yet to be completed.<br />
Process Overview<br />
The Intratec team’s first goal is to understand the chemical, biological and/or physical transformations occurring<br />
in the target process, as well as reactants required and products formation.<br />
Thus, initially, bibliographical research focuses on stoichiometry, conversions, yields and/or selectivity <strong>of</strong><br />
processes’ main reactions or biological processes, while also addressing the occurrence <strong>of</strong> side reactions and<br />
relevant information about catalyst employed.<br />
Regarding raw materials, the Intratec team identifies minimum quality requirements (e.g. minimum purity,<br />
maximum presence <strong>of</strong> specific contaminants), as well as typical industrial sources. For products, the Intratec<br />
team gathers information regarding possible uses and applications, as well as the usual specifications necessary<br />
to ensure their suitability for those applications.<br />
39
40
Examining an Industrial Site<br />
At this point, the Intratec team examines how an industrial site based on the process under analysis would be, in<br />
terms <strong>of</strong> production units and infrastructure required.<br />
<strong>Production</strong> Units<br />
The Intratec team compiles all knowledge acquired around the process into a process block flow diagram,<br />
showing major process areas and main process streams, accompanied by a process description. The process<br />
areas correspond to what Intratec defines as “functional units”. Basically, a “functional unit” is a significant step in<br />
the production process in which a particular physico-chemical operation (i.e., distillation, reaction, evaporation,<br />
etc.) occurs. According to this definition, a given functional unit is not associated with a single piece <strong>of</strong> equipment,<br />
but rather with a group <strong>of</strong> equipment and ancillaries required to perform a particular operation.<br />
Such division in process areas not only facilitates process understanding, but also serves as the basis for further<br />
economic analysis development.<br />
While outlining process block flow diagram, the Intratec team also maps key technical parameters related to each<br />
process area portrayed, including: highest operating temperature and pressure, representative material <strong>of</strong><br />
construction <strong>of</strong> equipment, and other parameters. These parameters serve as inputs for the cost estimating<br />
methods used by Intratec, further described in this methodology.<br />
Site Infrastructure<br />
The Intratec team also examines the industrial site in terms <strong>of</strong> the infrastructure (OSBL facilities) required. More<br />
specifically, this analysis identifies installations that are required but do not directly enter into the manufacture <strong>of</strong> a<br />
product (e.g., storage, utilities supply, auxiliary and administrative buildings).<br />
The first step in identifying the required infrastructure is to define the level <strong>of</strong> integration the industrial site under<br />
analysis will have with nearby facilities or industrial complexes. Integration levels primarily impact storage<br />
requirements – e.g., a plant that is not integrated needs storage for all raw materials and products, while a plant<br />
that is fully integrated with nearby complexes does not need such installations.<br />
The Intratec team assumes a level <strong>of</strong> integration based on what is most typical for the type <strong>of</strong> industrial plant<br />
examined. So, based on the process analysis previously developed and on how integrated the industrial site will<br />
be, the Intratec team defines the OSBL facilities requirements.<br />
Defining Site Requirements<br />
* Key Process Inputs & Outputs<br />
At this point, the main processing steps have been identified and global material balance calculations are<br />
performed. This preliminary global material balance leads to the identification <strong>of</strong> key process indicators, which<br />
reflect raw material consumption and products generation rates per amount <strong>of</strong> the main product manufactured.<br />
It is worth mentioning that estimation <strong>of</strong> raw material requirements in the conceptual design phase is generally<br />
reasonably accurate but tends to be somewhat understated compared to real operations. Losses <strong>from</strong> vessel<br />
vents, unscheduled equipment, inerting systems, physical property inaccuracies, startup, shutdown and other<br />
process operations not typically addressed in conceptual design may increase raw materials consumption.<br />
41
* Labor<br />
Operating labor is associated with the number <strong>of</strong> operators per shift actually required to run the equipment, while<br />
supervision labor is the personnel per shift required to directly supervise the operating labor.<br />
The number <strong>of</strong> operators and supervisors estimated is based on the type and number <strong>of</strong> functional units included<br />
in the process examined.<br />
Also, it is important to mention that in addition to the operating and supervision labor considered, chemical plants<br />
also require other types <strong>of</strong> labor, not included as an operating cost item. Examples <strong>of</strong> such labor are: maintenance<br />
labor, outsourced labor, technical assistance to manufacturing, plant engineers, restaurant, purchasing, employee<br />
relations department, etc.<br />
Capital Investment Estimating<br />
The costs that comprise the capital investment are grouped under three main headings: fixed capital; working<br />
capital; and additional capital requirements.<br />
Before estimating such capital investment figures, the Intratec team defines plant nominal capacity according to<br />
the process under analysis, considering that the plant should be competitive on a global scale.<br />
Once this assumption has been made, the Intratec team begins the actual estimation <strong>of</strong> the capital investment<br />
figures as follows.<br />
Fixed Capital<br />
The fixed capital is related to the erection <strong>of</strong> the industrial site itself. Also referred as “capital expenditures”<br />
(CAPEX), the fixed capital constitutes the fraction <strong>of</strong> the capital investment which is depreciable.<br />
It is composed <strong>of</strong> Inside Battery Limits (ISBL) Investment, Process Contingency, Outside Battery Limits (OSBL)<br />
Investment and Project Contingency, estimated as follows.<br />
* Inside Battery Limits (ISBL) Investment<br />
The ISBL investment is the fraction <strong>of</strong> the fixed capital associated with the construction <strong>of</strong> all process areas<br />
(functional units) portrayed in the process block flow diagram.<br />
Initially, to calculate ISBL investment, the Intratec team approaches each process area individually. The fixed<br />
capital <strong>of</strong> a given area is estimated based on the respective process parameters detailed in the block flow diagram<br />
(flow rates, pressure and temperature conditions, materials <strong>of</strong> construction, complexity), through the use <strong>of</strong><br />
specific preliminary cost models.<br />
It is worth noting that the Intratec cost models were founded on a number <strong>of</strong> established cost estimating methods,<br />
based on mathematical and statistical processing <strong>of</strong> an extensive volume <strong>of</strong> actual cost data <strong>of</strong> well-known<br />
industrial processes and functional units. In fact, such a massive refining <strong>of</strong> established methods has led to<br />
robust cost models, continuously tested and proven for more than a decade by major global companies that rely<br />
on Intratec’s cost estimates <strong>of</strong> industrial processes.<br />
So, <strong>from</strong> the process parameters identified, the output <strong>of</strong> Intratec cost models is the fixed capital for each<br />
functional unit, including all costs associated with the erection <strong>of</strong> those units: direct material and labor costs, as<br />
well as indirect costs, such as construction overheads, including: payroll burdens, field supervision, equipment<br />
42
entals, tools, field <strong>of</strong>fice expenses, temporary facilities, etc.<br />
In the case <strong>of</strong> nonstandard functional unit, additional research is conducted and the capital cost is estimated <strong>from</strong><br />
the use <strong>of</strong> specialized engineering design s<strong>of</strong>tware or through quotations provided by equipment suppliers.<br />
Finally, the sum <strong>of</strong> all fixed capital figures, associated with the functional units examined, leads to the total ISBL<br />
investment figure.<br />
* Process Contingency<br />
Process contingency is utilized in an effort to lessen the impact <strong>of</strong> absent technical information or the uncertainty<br />
<strong>of</strong> that which is obtained. That being the case, the reliability <strong>of</strong> the information gathered, its amount and the<br />
inherent complexity <strong>of</strong> the process are significant to its evaluation. Errors that occur may be related to:<br />
(1) Addition and integration <strong>of</strong> new process steps<br />
(2) Uncertainty in process parameters, such as severity <strong>of</strong> operating conditions and quantity <strong>of</strong> recycles<br />
(3) Estimation <strong>of</strong> cost through scaling factors<br />
(4) Off-the-shelf equipment<br />
Hence, process contingency is a function <strong>of</strong> the maturity <strong>of</strong> the technology and the reliability <strong>of</strong> the information<br />
gathered for the analysis. This value typically falls between 5% and 20% <strong>of</strong> ISBL investment.<br />
* Outside Battery Limits (OSBL) Investment<br />
The OSBL investment is the fraction <strong>of</strong> the fixed capital associated with the construction <strong>of</strong> all infrastructure<br />
(storage, utilities, auxiliary units and buildings) required.<br />
The Intratec team employs cost estimation models similar to those previously described for estimating OSBL<br />
investment, i.e., initially, a preliminary design <strong>of</strong> OSBL equipment is defined based on the process requirements.<br />
This preliminary design information serves as an input to Intratec's cost estimation models.<br />
* Project Contingency<br />
Project Contingency is included to cover the costs which may arise as the project evolves, related to: project errors<br />
or incomplete specifications, labor costs changes, strikes, problems caused by weather; inflation, etc.<br />
Project contingency is largely dependent on the plant complexity and technology maturity, identified during initial<br />
research. The following table shows how project contingency varies according to such aspects.<br />
Project Contingency<br />
PROCESS MATURITY<br />
PLANT COMPLEXITY<br />
Simple<br />
Typical<br />
Complex<br />
Established Industrial Processes<br />
15%<br />
20%<br />
25%<br />
New Industrial Processes<br />
20%<br />
25%<br />
30%<br />
Early-Stage Industrial Processes<br />
25%<br />
30%<br />
40%<br />
43
* Fixed Capital Validation<br />
Depending on the availability <strong>of</strong> information about the process examined, the Intratec team utilizes three different<br />
methods to double-check fixed capital estimates:<br />
(1) Published investment data, related to the construction <strong>of</strong> industrial plants <strong>of</strong> that process worldwide (adjusted<br />
in time, location and production capacity); and/or<br />
(2) Fixed capital <strong>of</strong> similar plants (adjusted in time, location and production capacity); and/or<br />
(3) Reverse engineering methods, i.e., the fixed capital is calculated based on the known pr<strong>of</strong>itability <strong>of</strong> the process<br />
examined.<br />
Fixed Capital Breakdown<br />
The report also presents a fixed capital breakdown, detailing how the fixed is divided into direct process costs and<br />
indirect process costs.<br />
The direct process costs comprise the following costs:<br />
* Bare Equipment. This is the cost associated with the purchase <strong>of</strong> process equipment<br />
* Equipment Setting. Those are costs related to the labor cost for setting the purchased equipment in place.<br />
* Piping. The costs related to piping include materials, such as valves, fittings, pipe and supports used in the<br />
erection <strong>of</strong> the piping used directly in the process (for raw materials, intermediate-products, finished-products,<br />
steam, water, air, as well as any other process piping). The labor for piping erection and installation is also covered<br />
in this topic.<br />
* Civil. This topic covers costs associated with material and labor required for equipment foundations and civil<br />
work related to any building required in the industrial site.<br />
* Steel. Costs associated with material and labor required for equipment platforms erection, as well as any<br />
supports needed during equipment installation.<br />
* Instrumentation & Control. Those costs relate to instruments, controllers and industrial networks material, and<br />
labor required to install it.<br />
* Electrical. The costs related to electrical system cover power wiring, instrument wiring, lighting, as well as<br />
transformation and service.<br />
* Insulation. Costs related to any labor or material required to insulate process equipment, either for process<br />
needs or for operators safety.<br />
* Painting. Those costs are related to labor and material required to paint and/or coat equipment according to<br />
process requirements.<br />
The indirect process costs are described below:<br />
* Engineering & Procurement. Engineering expenses include process and project engineers involved in process<br />
and construction design, as well as associated overhead. Development <strong>of</strong> computer-based drawings and cost<br />
engineering are also costs included in this topic. Procurement costs are those related to the purchase team,<br />
44
associated home <strong>of</strong>fice and overhead, and accounting pr<strong>of</strong>essionals.<br />
* Construction Material & Indirects. Those costs relate to field temporary buildings and their operation,<br />
construction tools, rentals, home <strong>of</strong>fice personnel located at the construction site, construction payroll, burdens<br />
and benefits.<br />
* General & Administrative Overheads. General and administrative costs are associated with construction<br />
management and general costs incurred during construction, such as construction supervision, taxes and<br />
insurance, internal and licensed s<strong>of</strong>tware, communications and travel & living.<br />
* Contract Fee. Expenses related to contract fees for engineering, equipment purchase and construction work.<br />
Fixed Capital Estimate Accuracy<br />
The accuracy range for the fixed capital cost estimate obtained according to the methods hereby presented is<br />
-15% to -35% on the low side and +25% to +60% on the high side. This accuracy range is mainly influenced by:<br />
* Reliability and amount <strong>of</strong> the information available<br />
* Examined technology maturity<br />
* Degree <strong>of</strong> extension <strong>of</strong> the study<br />
As previously explained, the fixed capital is estimated based on the preliminary design <strong>of</strong> functional units which, in<br />
turn, relies on a process scheme. The greatest essential uncertainty lies in the basic conception <strong>of</strong> this process<br />
scheme. The level <strong>of</strong> uncertainty varies broadly among published information and <strong>from</strong> steps <strong>of</strong> a process in a<br />
given research. In some instances, sufficient information may not be available to support rigorous estimation,<br />
thus, only basic design methods are warranted.<br />
The maturity <strong>of</strong> the examined technology, in turn, also plays an important role in the fixed capital estimates. Earlystage<br />
processes require an extra level <strong>of</strong> caution.<br />
In addition, the extension <strong>of</strong> the analysis helps enormously to reduce uncertainties and improve the accuracy <strong>of</strong><br />
the cost estimation. Detailed studies are crucial to achieving more precise estimates.<br />
Finally, the non-uniform spread <strong>of</strong> accuracy ranges (+50 to – 30 %, rather than ±40%, e.g.) is justified by the fact<br />
that a lack <strong>of</strong> available information usually results in underestimating rather than overestimating project costs.<br />
Working Capital<br />
For the purposes <strong>of</strong> Industrial Process reports, working capital is defined as the funds, in addition to the fixed<br />
capital, that a company must contribute to a project. Those funds must be adequate to getting the plant into<br />
operation and meeting subsequent obligations.<br />
The initial amount <strong>of</strong> working capital is regarded as an investment item.<br />
items/assumptions for working capital estimation:<br />
The Intratec team uses the following<br />
* Accounts receivable. Products shipped to but not paid for by the customer; represents the extended credit<br />
given to customers (estimated as a certain period – in days – <strong>of</strong> production cost including depreciation).<br />
* Accounts payable. A credit for accounts payable such as feedstock, chemicals, and packaging materials<br />
received but not paid to suppliers (estimated as a certain period – in days – <strong>of</strong> cash cost plus corporate overhead).<br />
45
* Product inventory. Products in storage tanks. The total amount depends on sales flow for each plant, which is<br />
directly related to plant conditions <strong>of</strong> integration to the manufacturing <strong>of</strong> the product‘s derivatives (estimated as a<br />
certain period – in days – <strong>of</strong> production cost including depreciation).<br />
* Raw material inventory. Raw materials in storage tanks. The total amount depends on raw material availability,<br />
which is directly related to plant conditions <strong>of</strong> integration to raw material manufacturing (estimated as a certain<br />
period – in days – <strong>of</strong> raw material delivered costs).<br />
* In-process inventory. Material contained in pipelines and vessels, except for the material inside the storage<br />
tanks (assumed to be 1 day <strong>of</strong> cash cost plus corporate overhead).<br />
* Supplies and stores. Parts inventory and minor spare equipment (estimated as a percentage <strong>of</strong> operating labor<br />
and supervision and maintenance cost).<br />
* Cash on hand. An adequate amount <strong>of</strong> cash on hand to give plant management the necessary flexibility to<br />
cover unexpected expenses (estimated as a certain period – in days – <strong>of</strong> cash cost plus corporate overhead).<br />
Additional Capital Requirements<br />
There are certain one-time expenses related to bringing a process on stream. From a time standpoint, a variable<br />
undefined period exists between the nominal end <strong>of</strong> construction and the production <strong>of</strong> quality product in the<br />
quantity required. This period is commonly referred to as start-up.<br />
During the start-up period, expenses are incurred for operator and maintenance employee training, temporary<br />
construction, auxiliary services, testing and adjustment <strong>of</strong> equipment, piping, and instruments, etc. Intratec’s<br />
method <strong>of</strong> estimating start-up expenses may consist <strong>of</strong> the following components:<br />
* Labor training. Represents costs <strong>of</strong> plant crew training for plant start-up, estimated as a certain number <strong>of</strong> days<br />
<strong>of</strong> total plant labor costs (operators, supervisors, maintenance personnel and laboratory labor).<br />
* Commercialization costs. Commercialization costs are those associated with marketing the product and<br />
include developing a market plan, establishing a distribution network and devising a customer support strategy.<br />
Those costs are dependent on how integrated the plant is with consumer facilities and on the maturity <strong>of</strong> the<br />
product – how established and well-known it is. These costs range <strong>from</strong> 0.5% to 5% <strong>of</strong> annual cash cost plus<br />
corporate overhead.<br />
* Start-up inefficiency. Takes into account those operating runs when production cannot be maintained or there<br />
are false starts. Start-up inefficiency varies according to the process maturity: 5% for early-stage processes, 2%<br />
for new processes, and 1% for established processes, based on annual cash cost plus corporate overhead.<br />
* Unscheduled plant modifications. A key fault that can happen occur during the start-up <strong>of</strong> the plant is the risk<br />
that the product(s) may not meet specifications required by the market. As a result, equipment modifications or<br />
additions may be required.<br />
* Prepaid Royalties. Royalty charges on portions <strong>of</strong> the plant are usually levied for proprietary processes. A value<br />
ranging <strong>from</strong> 0.5 to 1% <strong>of</strong> the fixed capital is generally used.<br />
* Site Development. Site preparation, including roads and walkways, parking, railroad sidings, lighting, fencing,<br />
sanitary and storm sewers, and communications.<br />
46
<strong>Production</strong> Cost Estimating<br />
Pricing & Wage Rates Definition<br />
In order to calculate fixed and variable manufacturing costs, the Intratec team collects average transaction prices<br />
<strong>of</strong> raw materials and average operators’ wage rates in the region examined in the study.<br />
The prices are based on trade statistics issued by <strong>of</strong>ficial government agencies, over the time period considered.<br />
Pricing information is checked to verify consistency, but issues like differences in product qualities, discounts<br />
related to volumes, or contractual negotiations are not considered.<br />
However, for some chemicals, there are no trade statistics (e.g., intermediate chemicals that are not traded<br />
because <strong>of</strong> transportation issues, but are usually generated and consumed onsite). In those cases, the Intratec<br />
team assumes a transfer price that considers all the costs related to the manufacturing <strong>of</strong> that product plus an<br />
amount to pay the investment made to manufacture it.<br />
The operators’ wage rates are based on data published by <strong>of</strong>ficial government agencies.<br />
Manufacturing Variable Cost<br />
Variable costs change in direct proportion to changes in the production level. Examples <strong>of</strong> common variable costs<br />
include raw materials and utilities.<br />
The Intratec team calculates the manufacturing variable costs <strong>of</strong> the plant under analysis <strong>from</strong> previously<br />
identified process input and output figures and historical pricing data, as follows:<br />
Manufacturing Variable Costs = Net Raw Material Costs + Net Utilities Costs<br />
* Net Raw Materials Costs<br />
“Net raw material costs” are the difference between raw materials costs and credits <strong>from</strong> by-products generation,<br />
as expressed in the formula below.<br />
Net Raw Material Costs = Raw Material Costs – By-product Credits<br />
The raw materials costs, in turn, are estimated by multiplying process’ consumption figures by the respective raw<br />
material prices in the region considered. The formula below illustrates the raw materials costs calculation:<br />
Raw Material Costs = Sum ( Raw Material Price * Raw Material Consumption )<br />
By-products credits were estimated in a similar way, based on process’ input and output figures and pricing data.<br />
* Net Utilities Cost<br />
In Industrial Processes <strong>Economics</strong> reports, the utilities cost component encompasses costs related to a plant’s<br />
consumption <strong>of</strong> steam, electricity, fuel, and refrigeration. These utilities requirements, in turn, are estimated<br />
through correlations internally developed by the Intratec team that were refined <strong>from</strong> a well-established method<br />
reported in technical literature by Mardsen et al. related to chemical process industries. (See “References” chapter)<br />
Through the use <strong>of</strong> these correlations, utilities consumption figures can be quickly estimated with basic<br />
information, related to chemical properties <strong>of</strong> components involved in the process and parameters presented in<br />
the block flow diagram. Such parameters include: number <strong>of</strong> functional units; type <strong>of</strong> each functional unit<br />
according to its energy consumption (i.e., if it involves phase changes, endothermic or exothermic reactions,<br />
47
negligible use <strong>of</strong> energy, if it is a nonstandard functional unit, etc.); flow rates; heats <strong>of</strong> reactions involved in the<br />
process; molecular weight and approximate boiling points <strong>of</strong> the components.<br />
Manufacturing Fixed Cost<br />
Manufacturing fixed costs are all the costs related to the plant operation that are not proportional to the plant<br />
operating rate. They are estimated as the sum <strong>of</strong> the following items:<br />
* Operating labor. This item accounts for the total costs <strong>of</strong> plant operators actually required to run the equipment.<br />
This cost includes wages, burdens and benefits. The annual operator cost is obtained according to the formula:<br />
number <strong>of</strong> operators per shift x number <strong>of</strong> shifts per day x operator hourly wage rate x hours worked per week x<br />
weeks per year.<br />
* Supervision. Accounts for the costs <strong>of</strong> field supervision labor, including wages, burdens and benefits. The<br />
annual supervision cost is obtained according to the formula: number <strong>of</strong> supervisors per shift x number <strong>of</strong> shifts<br />
per day x supervisor hourly wage rate x hours worked per week x weeks per year.<br />
* Maintenance cost. This item accounts for the costs related both to the labor and material costs related to the<br />
maintenance <strong>of</strong> the plant. It is calculated as a percentage <strong>of</strong> the fixed capital, ranging between <strong>from</strong> 1 to 5% <strong>of</strong><br />
TFC per year. This figure is primarily based on the type <strong>of</strong> equipment employed and the maturity <strong>of</strong> the process.<br />
* Operating charges. This category includes operating supplies (i.e., consumable items such as charts, lubricants,<br />
test chemicals, etc.); packaging; laboratory supplies and laboratory labor. It is calculated as a percentage <strong>of</strong> the<br />
total labor cost (item operating labor + item supervision).<br />
* Plant overhead. This item comprises all other non-maintenance (labor and materials) and non-operating site<br />
labor costs for services associated with the manufacture <strong>of</strong> the product, including: outsourced labor; technical<br />
assistance to manufacturing; plant engineers; restaurant; recreation; purchasing; employee relations department;<br />
and janitorial. It is calculated as a percentage <strong>of</strong> the sum <strong>of</strong> total labor and maintenance costs.<br />
* Property taxes and insurance. This cost is associated with the local property taxes charged by governments on<br />
commercial land or buildings as well as the cost <strong>of</strong> insurance to cover third party liabilities and potential plant<br />
damages. It is calculated as a percentage <strong>of</strong> the fixed capital per year.<br />
Depreciation<br />
Depreciation refers to the decrease in value <strong>of</strong> industrial assets with the passage <strong>of</strong> time, primarily due to wear and<br />
tear. While not a true manufacturing cost, depreciation is considered to be a manufacturing expense for<br />
accounting purposes – it allows the recovery <strong>of</strong> the cost <strong>of</strong> an asset over a time period.<br />
In this report, depreciation is calculated based on the straight-line method, according to which the cost <strong>of</strong> an asset<br />
is uniformly distributed over its lifetime. The Intratec team assumes a depreciation <strong>of</strong> 10 % <strong>of</strong> the fixed capital per<br />
year.<br />
Corporate Overhead<br />
Corporate overhead represents costs incurred by a company’s head <strong>of</strong>fice not directly related to the<br />
manufacturing process and is estimated as the sum <strong>of</strong> the following items:<br />
* Administration costs. This item comprises the executive and administrative activities. It includes salaries and<br />
wages for administrators, accountants, secretaries, legal costs, communications, <strong>of</strong>fice maintenance and other<br />
48
costs associated with the company’s head <strong>of</strong>fice. It is calculated as a percentage <strong>of</strong> the sum <strong>of</strong> total labor and<br />
maintenance costs.<br />
* Marketing & distribution. This is related to the costs associated with the distribution and sales (sales personnel,<br />
advertising, technical sales service) <strong>of</strong> the products manufactured in the plant. This cost is calculated as a<br />
percentage <strong>of</strong> the operating cash costs, considering the plant operating at full capacity, which varies according to<br />
the process maturity and the level <strong>of</strong> integration with product consumers.<br />
* Research & development. This is associated with the research activities related to the process and products<br />
and includes salaries and wages for personnel and funds for machinery, equipment, materials and supplies related<br />
to the research and development activities. This cost is calculated as a percentage <strong>of</strong> the operating cash costs,<br />
considering the plant operating at full capacity and will vary according to the process maturity.<br />
Product Value Estimating<br />
Heret<strong>of</strong>ore, capital investment and production cost <strong>of</strong> the process examined were estimated. The next step in the<br />
methodology is the development <strong>of</strong> a more consistent analysis, encompassing all costs estimated so far.<br />
In this context, all costs estimated are combined in a single item: the “Product Value”. More specifically, the<br />
product value results <strong>from</strong> the sum <strong>of</strong> production costs (i.e., manufacturing variable costs, manufacturing fixed<br />
costs, corporate overhead and depreciation) with a return on capital employed (ROCE), a parcel which reflects the<br />
capital investment. The formula below expresses the product value calculation.<br />
Product Value = Manufacturing Variable Costs + Manufacturing Fixed Costs + Corporate Overhead + Depreciation +<br />
Expected ROCE Amount<br />
where all components are expressed in US dollars per amount <strong>of</strong> product.<br />
The expected ROCE amount is a component which reflects the capital costs <strong>of</strong> a given process into its product<br />
value. This component is based on the expected return on capital employed typically aimed by chemical<br />
companies. It is calculated by multiplying capital costs by the expected ROCE percentage, divided by the total<br />
amount <strong>of</strong> product manufactured:<br />
Expected ROCE Amount = Capital Costs * Expected ROCE Percentage / Product Annual <strong>Production</strong><br />
This “Expected ROCE Amount” component is, in fact, a measure <strong>of</strong> the cost <strong>of</strong> investment required to construct the<br />
plant, in terms <strong>of</strong> US dollars per amount <strong>of</strong> product.<br />
Most chemical companies aim to achieve a ROCE percentage ranging <strong>from</strong> 10% to 30% for the construction <strong>of</strong> a<br />
new plant. In this context, the Intratec team assumes an expected ROCE percentage <strong>of</strong> 10% for established<br />
industrial processes.<br />
In contrast, a 30% expected ROCE is assumed for emerging industrial processes, as such processes inherently<br />
involve a larger amount <strong>of</strong> risk and cost uncertainty. It should be noted that the risk taken into account here is<br />
limited to the technical risk associated with the process uncertainties. Other venture risks were not considered,<br />
such as business environment, product market changes, increased competition, raw materials and product prices<br />
variations, change in government policy, etc.<br />
Finally, it is also important to mention that product value must not be confused with product price. While the<br />
product value is calculated based on production cost and expected ROCE, the product price is the actual value<br />
49
practiced in market transactions.<br />
Estimates Limitation<br />
The cost estimates presented in Industrial Processes <strong>Economics</strong> reports refer to a process technology based on a<br />
standardized design practice, typical <strong>of</strong> major chemical companies. The specific design standards employed can<br />
have a significant impact on capital and production costs. In this context, cost estimates calculated by Intratec<br />
team naturally have limitations.<br />
In fact, the accuracy range for production cost estimated in the present study is -10% to -20% on the low side and<br />
+10% to +20% on the high side, depending on the maturity level <strong>of</strong> the process examined. The presented accuracy<br />
considers a confidence level <strong>of</strong> 90%, which is consistent with the type <strong>of</strong> conceptual evaluation that this study<br />
aims to provide.<br />
Also, it is to be noted that the basis for capital and production costs estimation is that the plant is considered to be<br />
built in a clear field with a typical large single-line capacity. In comparing the cost estimates presented with actual<br />
plant costs and/or contractor's estimate, the following must be considered:<br />
* Minor differences or details (many times, unnoticed) between similar processes can noticeably affect cost.<br />
* The omission <strong>of</strong> process areas in the design considered may invalidate comparisons with the estimated cost<br />
presented.<br />
* Industrial plants may be overdesigned for particular objectives and situations.<br />
* Rapid fluctuation <strong>of</strong> equipment or construction costs may invalidate cost estimate.<br />
* Market price fluctuations may invalidate production cost estimate.<br />
* Equipment vendors or engineering companies may provide goods or services below pr<strong>of</strong>it margins during<br />
economic downturns.<br />
* Specific locations may impose higher taxes and fees, which can impact costs considerably.<br />
Furthermore, no matter how much time and effort are devoted to accurately estimating costs, errors may occur<br />
due to the aforementioned factors, as well as cost and labor changes, construction problems, weather-related<br />
issues, strikes, or other unforeseen situations. This is partially considered in the project contingency. Finally, it<br />
must always be remembered that an estimated project cost is not an exact number, but is rather a projection <strong>of</strong><br />
the probable cost.<br />
50
ABOUT INTRATEC<br />
Our Business<br />
Intratec is an independent research and leading advisory firm, recognized for excellence in the evaluation <strong>of</strong><br />
chemical markets and the economics <strong>of</strong> industrial process. We are a mix <strong>of</strong> process engineers, market researchers<br />
and cost estimators with extensive industry experience.<br />
Since 2002, the reports and databases we provide have increased the early recognition <strong>of</strong> promising research and<br />
capital investment opportunities in the chemical, petrochemical, oil, plastic, renewable and allied sectors. Our<br />
products have been used by our clients in multiple ways, such as:<br />
* To understand chemical market size, dynamics and attractiveness<br />
* To understand the feasibility <strong>of</strong> competitors’ technologies and developments<br />
* To obtain estimates <strong>of</strong> ventures’ pr<strong>of</strong>itability, capital and operating costs<br />
* To assess the economic potential <strong>of</strong> R&D breakthroughs<br />
* To ascertain the economic aspects and risks <strong>of</strong> their competitors’ research<br />
* To screen and assess industrial investment options<br />
* To define consistent business cases for investments<br />
* To evaluate / select independent licensors<br />
Our Reports<br />
Intratec has an extensive portfolio <strong>of</strong> reports targeting chemical markets and process economics. With more than<br />
900 up-to-date reports for the chemical, petrochemical, oil, energy, plastic, renewables and allied sectors, the<br />
Intratec portfolio is constantly growing.<br />
Intratec <strong>of</strong>fers the following types <strong>of</strong> reports:<br />
* <strong>Production</strong> Pathways Reports: Reports presenting paths to producing chemical and preliminary economic<br />
comparisons <strong>of</strong> those paths. From these reports, you can learn the ways in which changes in feedstocks and<br />
location can affect chemical production economics.<br />
* Industrial Process Reports: Techno-economic evaluations <strong>of</strong> chemical production processes. Each report<br />
provides an up-to-date economic assessment, including required capital costs in several locations and operating<br />
costs.<br />
51
Find below the chemicals covered in Intratec reports.<br />
encouraged to visit www.intratec.us.<br />
For a more complete and updated list, the reader is<br />
3-Hydroxypropionic Acid<br />
Acetone<br />
Acetylene<br />
Acetyls<br />
Acrylic Acid and Derivatives<br />
Acrylic/Maleic Copolymer<br />
Acrylonitrile<br />
Adipic Acid<br />
Aldehydes<br />
Alkylbenzenes<br />
Amino Acids<br />
Ammonia<br />
Aniline<br />
Biodiesel<br />
Bisphenol A<br />
BTX<br />
Butadiene and C4's<br />
C6's<br />
Caprolactam<br />
<strong>Carbon</strong> Monoxide<br />
Chlorine and Derivatives<br />
Chloroprene<br />
Citric Acid<br />
Cosmetics<br />
Cumene<br />
Detergents<br />
Dicyclopentadiene<br />
Diesel<br />
Dimethyl <strong>Carbon</strong>ate (DMC)<br />
Dimethyl Terephthalate<br />
Diols<br />
Diphenyl <strong>Carbon</strong>ate<br />
Dyes & Pigments<br />
Electricity<br />
Epichlorohydrin<br />
Ethanol<br />
Ethylene<br />
Ethylene Oxide<br />
Fertilizers<br />
Fibers<br />
Fire Retardants<br />
Food Additives<br />
Furans and Derivatives<br />
Glycerol<br />
Glycols<br />
Hydrogen<br />
Hydrogen Cyanide<br />
Hydrogen Peroxide<br />
Industrial Gases<br />
Insecticides<br />
Isocyanates<br />
Isophthalic Acid<br />
Isoprene<br />
Lactic Acid<br />
Linear Alpha Olefins<br />
Methacrylic Acid and Derivatives<br />
Methanol<br />
MTBE<br />
Nitric Acid<br />
Nitro Aromatics<br />
Nylon<br />
Oxalic Acid<br />
Oxo Alcohols<br />
Pentaerythritol<br />
PET<br />
Pharmaceuticals<br />
Phenol<br />
Phosgene<br />
Phthalic Anhydride<br />
Polyacrylate<br />
Polyacrylonitrile<br />
Polyalphaolefins<br />
Polycarbonates<br />
Polyesters<br />
Polyethers<br />
Polyethylenes<br />
Polylactic Acid (PLA)<br />
Polypropylene<br />
Polyurethanes<br />
Propanol and Isopropanol<br />
Propylene<br />
Propylene Oxide<br />
PVC<br />
Reformate<br />
Resins<br />
Silanes<br />
Silicones<br />
Siloxanes<br />
Sodium Hydroxide<br />
Speciality Polymers<br />
Styrenics<br />
Succinic Acid<br />
Sulfuric Acid<br />
Synhetic Rubbers<br />
Synthesis Gas<br />
Vitamins<br />
Terephthalic Acid<br />
Trimethylolpropane<br />
Urea<br />
Vinyls<br />
52
APPENDIX 1: FIXED CAPITAL REGIONAL COMPARISON<br />
Obviously, the fixed capital required to erect an industrial unit is highly impacted by local conditions. By way <strong>of</strong><br />
illustration, several country-specific factors can largely influence construction costs, such as local productivity,<br />
labor costs, local steel prices, equipment imports needs, freight, taxes and duties on imports, regional business<br />
environments, local availability <strong>of</strong> sparing equipment, and so on.<br />
In this context, this appendix shows how much the fixed capital <strong>of</strong> the plant examined would be in different<br />
locations. Considering the same industrial plant previously described, this analysis compares fixed capital across<br />
the following countries:<br />
- United States<br />
- Germany<br />
- China<br />
- Japan<br />
- Saudi Arabia<br />
- Brazil<br />
- Singapore<br />
As an example, the following figure compares the fixed capital in the aforementioned countries.<br />
Fixed Capital per Region (USD Million)<br />
Regional fixed capital figures presented were directly obtained <strong>from</strong> the fixed capital originally calculated (United<br />
States-based plant), according to Intratec’s chemical plant location factors. These factors are calculated based on<br />
high volumes <strong>of</strong> local data <strong>of</strong> different locations, relating to productivity, labor costs, steel and energy prices,<br />
equipment import needs, freight, taxes and duties on imported and domestic materials and regional business<br />
environment, among others.<br />
53
APPENDIX 2: INTRATEC CHEMICAL PLANT CONSTRUCTION INDEX<br />
The IC Index stands for Intratec Chemical Plant Construction Index, an indicator published monthly by Intratec to<br />
scale capital costs <strong>from</strong> one time period to another. By way <strong>of</strong> illustration, to update a plant construction cost<br />
<strong>from</strong> 2009 to 2015, is necessary to multiply the cost at 2009 by the ratio <strong>of</strong> 2015’s index over 2009’s index,<br />
according to the following equation:<br />
Cost at 2015 = Cost at 2009 * (IC Index at 2015) / (IC Index at 2009)<br />
This index reconciles price trends <strong>of</strong> fundamental components <strong>of</strong> chemical plant construction such as labor,<br />
material and energy, providing meaningful historical and forecast data for our readers and clients.<br />
Covering historical figures and near term forecasts <strong>of</strong> up to twelve months, the IC Index is already a recognized<br />
cost-escalation index, widely used by the chemical industry community. It is a handy tool for a series <strong>of</strong> purposes,<br />
like procurement budgeting, capital project estimation and feasibility assessments.<br />
Figure. Intratec Chemical Plant Construction Index<br />
Readers can access Intratec construction cost-escalation index for free, at www.intratec.us. It is the only index<br />
available in the market that presents forecast and historical data.<br />
54
www.intratec.us